Project Burn Rate: The Complete Guide for Professional Services Teams (2026)

•
•
Summarize blog with






Most PS teams find out about a budget overrun the same way. In a post-mortem — after the project has closed, after the margin is gone, after nothing can change.
On a $200,000 fixed-fee project with a 30% margin target, a 20% overrun does not reduce profit. It eliminates it.
A $60,000 gain becomes a $40,000 loss. No missed go-live. No client complaint. Just hours logged quietly against the wrong tasks, scope absorbed informally, and a burn rate nobody was watching.
That is the most common burn rate failure pattern in professional services: not overspending, but finding out after it no longer matters.
Project burn rate is the rate at which a project consumes its allocated budget or hours over a given period.
For professional services and implementation teams, it is the financial signal that determines whether margin targets hold through delivery — or erode silently between status calls.
PS teams that track project burn rate in real time catch overruns before they compound. Teams that review it monthly catch them after the invoice has gone out.
Healthy PS organizations hold budget consumption within 5% of scope completion and maintain 30–40% gross margin across the portfolio. Most do not.
This guide covers the burn rate formulas PS teams use day-to-day, how interpretation varies across fixed-fee, T&M, retainer, and agile billing models, what causes burn rate to spiral undetected, and how Rocketlane Nitro's agentic AI catches overruns before they surface in a monthly report.
What is project burn rate?
Project burn rate is the rate at which a project consumes its allocated budget or hours over a given period. In professional services, it tracks hourly burn and revenue burn together to signal whether margins will hold.
Hourly burn measures team hours used against the plan. Revenue burn measures the consumption of the financial budget based on billable time and cost rates.
Burn rate is a delivery health signal, not only a finance metric. A project burning too fast is heading toward an overrun.
A project burning too slowly often signals underresourcing or milestone slippage that compresses effort late in the project management lifecycle.
Tracking burn rate across the full project life cycle helps teams manage risks alongside cost management and ongoing resource planning.
Hourly burn measures the team's hours consumed relative to the project plan. Revenue burn measures how quickly the financial budget is being used based on billable time and cost rates.
Tracking both against scope progress shows the complete picture of delivery health. Monitoring project cost and project risks using a project management tool is essential for effective burn rate management, as it helps document and control risks, issues, and dependencies throughout the project.
In professional services, burn rate is inseparable from margin. Senior consultants billing junior-scope work, non-billable rework, and silent scope creep all burn margin invisibly. The same formula applies across consulting projects, agency retainers, software implementations, and construction project lifecycles.
The interpretation, not the math, changes by industry. For more context on project risk management basics, see how risk discipline supports burn rate accuracy.
Project burn rate vs. budget burn rate: Is there a difference?
Project burn rate and budget burn rate are often used interchangeably, but they measure different things. Project burn rate tracks the overall pace of resource consumption across hours and costs. Budget burn rate measures specifically how quickly the financial budget is being depleted.
Tracking both metrics across the project lifecycle and different project stages provides a more comprehensive view of project profitability and health.
For PS teams, tracking both against project progress gives the most complete picture of financial health and margin exposure.
What does "burning" mean in project management?
In project management, “burning” refers to the consumption of budget, hours, or resources. Project work and project activities are the primary drivers of this resource consumption; tracking these elements helps understand and manage the project burn rate.
A project that is burning up is consuming resources faster than planned. A “burned project” has exhausted its budget before project completion, often without enough scope delivered to justify the spend.
The term “project burner” captures the same condition: the financial side has outpaced the delivery side.
What types of burn rate should PS teams track?

Most burn rate guides treat burn rate as a single number. In professional services, four distinct dimensions matter. They are hourly burn, revenue burn, gross and net burn, and budget consumption rate.
Conflating them is how teams end up with a healthy dashboard hiding an unprofitable portfolio. These four key aspects matter across most projects, from large enterprise programs to fast-moving sprints.
Tracking burn rate across various project elements, such as risks, issues, assumptions, and decisions, and organizing these within a breakdown structure allows teams to identify where resources are being consumed most rapidly and to better plan, control, and report on project progress.
1. Hourly burn rate
Hourly burn rate measures the pace at which allocated project hours are consumed relative to the planned timeline. It answers the question: Are we using hours faster or slower than our project plan assumed?
Hours are the raw material of service delivery in PS. Hourly burn ahead of schedule without matching progress signals a problem weeks before the financial numbers move.
The usual causes are scope creep, underestimation, or resource inefficiency. To ensure accountability in hour tracking and prevent these issues, it’s important to assign ownership for each task so that a responsible person oversees and reports on the hours used.
2. Revenue burn rate
Revenue burn rate measures how fast the project budget is consumed by billable time. It is where burn rate meets cost.
The calculation factors in cost and bill rates for each resource. It connects hours consumed to financial impact, showing what those hours cost and what they generate. See how teams optimize billable utilization for success.
Two projects burning the same hours can have completely different revenue burn rates if staffed differently. A senior consultant at $250/hr burns revenue four times faster than a junior at $65/hr. Resource allocation decisions should align with the overall project direction to ensure that staffing choices support strategic goals and optimize project profitability outcomes.
3. Gross burn rate vs. net burn rate
Gross burn rate is the total project spend in a given period, including all costs, billable and non-billable.
Net burn rate subtracts any revenue recognized in that period, showing the net cash consumption. For PS teams on fixed-fee projects, net burn rate is the more relevant margin indicator.
4. Budget consumption rate
Budget consumption rate measures the percentage of the project budget spent at any given point; it is also called burn rate. Teams compare it against the percentage of the project scope delivered.
The gap between budget consumed and scope delivered is the most direct indicator of a trending write-off.
A project at 65% of the budget consumed but 40% of the scope delivered has a 25-point gap. That gap is the kind of early warning signal that needs immediate attention.
Proactive management of these budget consumption gaps can prevent costly overruns by addressing issues before they escalate.
For deeper context, see this project's billing complete guide.
How do you calculate project burn rate?
The basic project burn rate formula is: Burn Rate = Total Amount Spent ÷ Time Elapsed.
This burn rate calculation gives the average spend per time period. Professional services teams typically calculate it weekly or monthly. They compare the actual rate against the planned spend to spot variance early.
Many teams use project management software to automate burn rate calculations and gain real-time insights into project spending. Industry resources like the Project Management Journal explore these calculations in depth, but the practical formulas below are the ones PS teams use day-to-day.
Step 1: Gather your inputs. Five numbers feed every calculation:
- Confirm total project budget (hours and dollars)
- Pull total hours tracked to date
- Pull total costs to date (labor and expenses)
- Note the time elapsed in weeks or months
- Pull planned spend to date from your financial plan
- Ensure accurate project documentation is maintained, as it provides reliable data for cost estimation in projects.
Step 2: Calculate basic burn rate (also called actual burn rate)
- Formula: Burn Rate = Total Spent ÷ Time Elapsed.
- Example: $300,000 project, $120,000 spent over 3 months, burn rate = $40,000 per month.
The planned monthly burn was $33,333, so the actual is running 20% above plan.
Step 3: Calculate burn rate as a percentage of the budget
- Formula: Burn Rate % = (Total Spent ÷ Total Budget) × 100.
- Same example: ($120,000 ÷ $300,000) × 100 = 40% budget consumed.
The project is 3 months into a 9-month timeline.
Expected consumption is 33%, so 40% means the project is 7 points ahead of plan.
Step 4: Calculate the projected (or predicted) burn rate to completion
Formula: Projected Total Cost = Total Spent ÷ % Work Complete.
At 30% complete and 40% budget consumed, the math is $120,000 ÷ 0.30 = $400,000 against a $300,000 budget. That overrun is $100,000 if nothing changes. The same formula doubles as a runway estimate.
Step 5: Calculate daily or hourly burn rate for shorter cycles
- Daily burn rate: Total Budget ÷ Total Project Days.
- Hourly burn rate: Total Budget ÷ Total Budgeted Hours.
Daily and hourly views suit short-duration projects, sprint-based delivery, and T&M engagements.
All five formulas live in the free Project Burn Rate Template above. For broader guidance, see this guide to nail your project delivery.
Burn rate formula in PMP
The Project Management Professional (PMP) methodology was developed by the Project Management Institute (PMI). PMP expresses burn rate through Earned Value Management (EVM). The PMP burn rate formula is:
Burn Rate = Actual Cost (AC) ÷ Budgeted Cost of Work Performed (BCWP).
A burn rate above 1.0 means the project is spending more than it generates in value. That ratio is a direct signal of budget overrun risk in earned value tracking.
How do you interpret a project's burn rate?
The logic of interpreting the burn rate value depends on context. Calculation is the easy part. Interpretation is where most PS teams fall short.
Burn rate is only meaningful relative to project progress. A high burn rate on a project ahead of schedule can be healthy. A moderate burn rate on a project behind schedule is a crisis.
Burn rate health matrix:
Three burn rate signals deserve immediate attention.
- Burn rate is accelerating mid-project: This often signals scope creep absorbing unplanned hours, or senior resources doing work scoped for junior staff. Both eat margin without showing up as scheduled slippage.
- Burn rate decelerating late in the project: Teams are rushing to close, often a sign that they are quietly absorbing non-billable rework to hit go-live. The financials look better than the underlying margin shows.
- Burn rate flat but progress stalled: A dependency blockage or client-side delay is consuming budget without advancing scope. The project is burning money standing still. Most of these blockers are the kind that a well-maintained RAID log would have flagged early.
- Portfolio-level burn rate hides the detail that matters: a project can look on track overall while one phase is critically over budget and another is artificially ahead. Phase-level burn rate analysis is where the data becomes useful, not only observable. See project risk management for PS for related guidance.
A burn rate report showing only total spend versus total budget is like a speedometer with no fuel gauge. It tells you how fast you are going, not whether you will make it to the destination. Strong project governance best practices close this gap.
Which burn rate charts and reports should PS teams use?

Formulas tell PS teams what is happening. Charts show it. The right visualization turns burn rate from a number into a signal anyone on the project can read.
Burn rate chart (spend over time)
A burn rate chart, also called a burn rate vs. time graph, plots actual spend against planned spend. The two lines run over the project timeline. When the actual line rises above the planned line, the project is burning through budget faster than planned.
Burn rate charts work best for fixed-fee projects, where any overrun comes directly from margin. They pair well with guidance on creating a Gantt chart for end-to-end visibility.
Burndown chart in project management
A burndown chart, also called a budget burndown, plots remaining budget or hours from the total down to zero. A steeper slope means faster resource consumption. The slope itself is the burndown rate.
Burndown charts are common in agile project management for tracking sprint velocity. The main limitation is that a burndown chart does not show scope changes. If the scope increases, the starting point shifts, and the chart loses accuracy without manual adjustment.
Burn-up chart
A burn-up chart shows work completed over time, rising toward the total scope line. The advantage over a burndown chart is that when the scope increases, the total scope line moves up.
Scope creep becomes visible rather than hidden in a steeper burndown slope. Burn-up charts work best for client-facing projects where scope changes need to be transparent. Pair them with a RACI chart for projects to clarify ownership.
Burn rate report
A complete project burn rate report, sometimes called a burn report, contains six elements. For a complementary template, see this project status report template:
- Compare the current burn rate against the planned
- Track budget consumed versus scope delivered
- Estimate cost to completion
- Show variance by phase
- Surface resource-level contribution to burn
- Project margin at completion
Run the report weekly for active projects and monthly for portfolio leadership review. These reports sit alongside the project schedule, critical path, network diagram, and work breakdown structure as the core artifacts of project oversight.
Strong reporting in PSA software ties them all together.
What causes burn rate to spiral, and why do project managers and PS teams miss it?

Burn rate spirals are not random. They follow predictable patterns that PS leaders see every quarter, and that finance only sees in post-mortems. Six root causes drive most of the damage.
- Scope creep absorbed silently: The client asks for one more small addition on a Tuesday call. The PM agrees informally. No change order. Teams log the hours. The budget erodes. By the time finance notices, twelve small additions have stacked up, and the project is 35% over budget.
Effective change management for onboarding is critical here; it ensures that all modifications are properly tracked, documented, and assessed for impact, helping to control the project burn rate and prevent unplanned overruns. - Wrong resource staffing without cost visibility: A senior architect joins a task scoped for a mid-level consultant because the architect is available. Nobody checks the burn rate consulting cost differential. That single staffing decision burns $4,000 of unplanned margin in a week.
- Non-billable time is never categorized: Teams log rework, internal meetings, travel time, and training hours against project tasks rather than non-billable codes. The burn rate looks high, but the quality of the deliverable is not improving. The financial picture is inaccurate. See non-billable time impact for more.
- Timesheet lag creates a financial blind spot: Teams submit timesheets weekly or bi-weekly. By the time last week’s hours hit the burn rate report, the project had burned another week of budget.
For a fast-burning phase, that lag is the difference between catching an overrun and discovering it. See "overcoming time-tracking objections" for adoption tactics.
- Multi-project portfolio masks individual performance: Profitable projects mask unprofitable ones at the portfolio level. Leadership sees blended margin and assumes health. The projects bleeding money stay invisible until a client escalation or the post-mortem reveals them. The damage is portfolio-wide, even if no single dashboard ever flags it.
- Fixed-fee economics create a dangerous illusion: A fixed-fee project billing $200,000 looks like guaranteed revenue. If the team burns $210,000 in costs to deliver it, revenue recognition masks a $10,000 loss. The loss only surfaces when someone runs the margin calculation. A 20% overrun on a 30% margin project turns a $60,000 profit into a $40,000 loss. Read strategies improving profit margin for more.
Every mistake in this list shares the same root cause. Teams treat burn rate as a reporting metric rather than a management signal.
Burn rate data that arrives after teams have made decisions is history, not intelligence. By then, the team has logged the hours, committed the resources, and accepted the scope. The teams that protect margins consistently see burn rate as it happens, not as it was.
Burn rate management is an ongoing process that requires regular review and adjustment to ensure project success and compliance.
Most projects benefit from a clear resolution plan when the gap between burn and progress widens. Reasons for failure are explored in the reasons onboarding goes wrong.
See what real-time burn rate tracking looks like inside a PSA. [Download the free template]
How does the burn rate calculation change by billing model?
A burn rate calculation that works for a T&M engagement gives misleading numbers on a fixed-fee project. The formula is the same. The interpretation, thresholds, and action triggers are completely different.
In software development project delivery, which often uses iterative and incremental approaches such as Agile and Scrum, specialized burn rate tracking is essential for effectively managing unique uncertainties and evolving requirements.
1. Burn rate on fixed-fee projects
On a fixed-fee project, every hour over budget is a margin write-off, with no client mechanism to recover overspend. Track budget consumption rate against scope completion percentage.
The gap is the margin of exposure. When budget consumption exceeds scope completion by more than 10 points, leadership needs to step in. See this project's billing complete guide for billing model context.
Worked example: a $180,000 fixed-fee project at 55% of budget consumed ($99,000) and 40% of scope delivered. The 15-point gap projects to a $45,000 overrun, half the original margin.
2. Burn rate on time-and-materials (T&M) projects
On a T&M project, burn rate correlates directly to revenue recognized. Burning faster means billing more, but the project also ends sooner. Track actual hours × bill rate against the contracted ceiling on capped T&M.
Watch utilization of allocated resources, and confirm teams are not logging non-billable hours as billable. The contract burn rate measures how fast the team consumes the contracted T&M value. For capped T&M, contract burn rate is the critical number. Related: subscription billing best practices.
3. Burn rate on retainer projects
On a retainer engagement, burn rate must stay within the monthly retainer value. Under-burning wastes contracted capacity that the client has already paid for. Over-burning erodes the margin without additional revenue.
When issues arise or dependency conflicts threaten service quality, allocating additional resources may be necessary to resolve problems and maintain performance.
Track monthly hours burned against retainer hours included. Monitor rollover policies and check whether the retainer scope is drifting upward without a contract renewal. Most retainer engagements also need a quarterly true-up to reset the baseline.
Teams running multiple projects under a single retainer should track the burn rate for each workstream to maintain margin clarity. For more on this model, see retainers for professional services.
4. Burn rate in agile and sprint-based delivery
In agile delivery, teams calculate a burn rate per sprint, sometimes called "agile burn rate" or "sprint burn rate." The metric measures how quickly teams consume the sprint budget or story points relative to planned velocity.
For PS teams running iterative implementations, sprint-level burn rate connects to overall project margin through cumulative burn across sprints.
Agile methodologies are particularly effective for managing burn rate in complex projects, as they allow for adaptive planning and continuous monitoring.
Key consideration: Agile scope flexibility complicates burn rate management. If the scope expands between sprints, the budget needs adjustment, or the comparison loses its reference point.
What are the best practices for burn rate for PS teams?

Seven practices separate teams that govern burn rate proactively from teams that report it after the fact. The list below covers the mechanics and the failure mode for each one.
These management strategies reinforce standard operating procedures that protect margins while keeping delivery moving. See implementation best practices for related guidance.
- Set budget alerts at multiple consumption thresholds: Configure burn rate limit notifications at 50%, 75%, and 90% of budget consumed. At 100%, there is nothing left to do. At 75%, the team has time for a scope conversation, cost adjustment, or change order. What breaks without it: teams discover the overrun only when they try to close the project. See capacity planning benefits.
- Track burn rate at the phase level, not project level: Every phase has its own budget and burn rate. Review phase-level burn weekly. What breaks without it: a project looks healthy overall, while one phase has consumed double its budget.
- Compare burn rate to scope completion every week: The burn-to-progress ratio is the most important number in PS financial management. It tells you whether the hours consumed are translating into delivered value. What breaks without it: burn rate alone shows how fast you are spending. It does not tell you if you are getting value for the spend. For broader playbook guidance, see improve project profitability.
- Enforce timesheet submission within 24 hours of work done: A burn rate calculated on week-old timesheets is a week behind reality. Daily or next-day submission creates a near-real-time financial picture. What breaks without it: a weekly cycle creates a rolling blind spot that is expensive on fast-burning projects.
- Make the cost rate visible at the time of resource allocation: When staffing a project, show the PM each resource option’s cost rate along with availability and skills. What breaks without it: PMs optimize for availability and skills, finance optimizes for cost, and margin pays the price. See mastering project planning steps.
- Build a formal change order threshold into every project: Unplanned work exceeding 5%-10% of the total scope triggers a formal change order before the work proceeds. What breaks without it: scope creep accumulates silently. Informal burn unrecovered hours until the project is unsalvageable.
- Use historical burn rate data to improve future estimates: At project close, record the actual burn rate by phase, resource type, and project type. Feed it into the estimation model for the next project of the same type, and apply lessons learned to future projects to continually improve project planning and management. What breaks without it: teams estimate from intuition and repeat the same underestimation patterns year after year. See project governance best practices.
What does a healthy burn rate look like in professional services?
What “good” looks like depends on the billing model, project type, delivery phase, the project’s complexity, the organization’s project portfolio management practices, and the strategic decisions guiding project planning.
Within those qualifiers, there are ranges that mark the shift from risk to health. These ranges give PS leaders something concrete to measure against and to share with the exec team.
None of these benchmarks replaces project-specific context, but each one signals when a closer look is needed. For benchmark depth, refer to the PS Maturity Benchmark Model.
Healthy burn rate indicators by project type:
- Utilization as a burn rate proxy: PS teams targeting 70% to 85% billable utilization are, in effect, managing a portfolio-level burn rate. When utilization drops below 70%, non-billable hours are consuming capacity that should be revenue-generating. When it consistently exceeds 85%, the team is likely burning hours on unplanned work. Burnout and quality slippage usually follow. Utilization is a portfolio-level signal, not a project-level one. It is the cleanest leading indicator of margin direction. See capacity and utilization mastery.
- The margin threshold: Most PS organizations target 30% to 40% gross margin. A burn rate 15% above plan on a 30% margin fixed-fee project does more than reduce margin. It eliminates the margin entirely and results in a loss for the project. The same overrun on a higher-margin project is recoverable. On a thin-margin project, it is fatal. See resource management KPIs.
- Global context: These benchmarks hold across North American, European, and APAC PS markets. The billing model mechanics are universal, even when rate cards vary significantly by region. A 15% overrun is a 15% overrun, whether priced in dollars, euros, or rupees. For more, see improving project profit margin.
Why does burn rate tracking break down at scale?

The spreadsheet ceiling. A burn rate spreadsheet works fine for one PM managing two projects. Small teams can manage budgets and burn rates this way for years. It breaks when 15 PMs are managing 80 projects in parallel.
Manual updates, formula errors, version conflicts, and data lag accumulate. The burn rate report becomes a historical document, never a live signal. By the time the team knows the project is over budget, it is too late to course-correct.
- The tool fragmentation problem: Project data lives on Monday or Asana. Time tracking sits in Harvest or Clockify. Financials run in QuickBooks or NetSuite. None of these systems talks to each other. Finance reconciles them manually at month-end. By that point, the decision window for any project has already closed. Using a unified purpose-built PSA platform and a structured approach to burn rate tracking can centralize project data, reduce manual reconciliation, and provide real-time visibility into project health.
- The approval lag problem: Teams submit timesheets on Friday, managers approve them on Monday, finance reconciles them on Wednesday, and the report shows them on Thursday. For a project burning $15,000 a week, that is a week of financial blindness, every week, all year.
- The portfolio visibility gap: “How are our margins looking this quarter?” The VP of PS does not know. The data exists, but it sits across 15 PM spreadsheets and two finance systems. The answer takes 3 hours to compile and goes stale before delivery. Everything is in spreadsheets, and nothing is in the room when the decision is made. Communicating budget exposure across multiple stakeholders becomes nearly impossible without a single source of truth. See beginner’s guide PSA software.
- The consequence at scale: PS organizations that cannot see burn rate in real time cannot price accurately. They cannot staff intelligently. They cannot identify which project types are unprofitable. They cannot scale delivery without proportionally scaling headcount. The tool problem is a growth ceiling, and margin pressure compounds every quarter. The leaders running these organizations are flying blind on their most important financial signal. See legacy PSA vs Rocketlane.
Effective burn rate management is essential for achieving desired project outcomes and overall project success, as it ensures that projects deliver strategic benefits and align with business objectives.
On a fixed-fee project with a 30% margin target, the delivery team is flying blind without visibility into the burn rate. Finance can report the damage. Only the delivery team can prevent it.
How does Rocketlane compare to other PSA and PM tools?
Most PS teams evaluate Rocketlane against legacy PSA platforms (Kantata, Certinia, NetSuite OpenAir) or stitched-together PM + time-tracking stacks (Monday or Asana paired with Harvest or Clockify).
The table below compares burn rate governance capabilities across these options. G2 ratings are approximate and reflect publicly listed scores at the time of writing; verify the latest before citing externally.
How Rocketlane gives PS teams real-time burn rate visibility
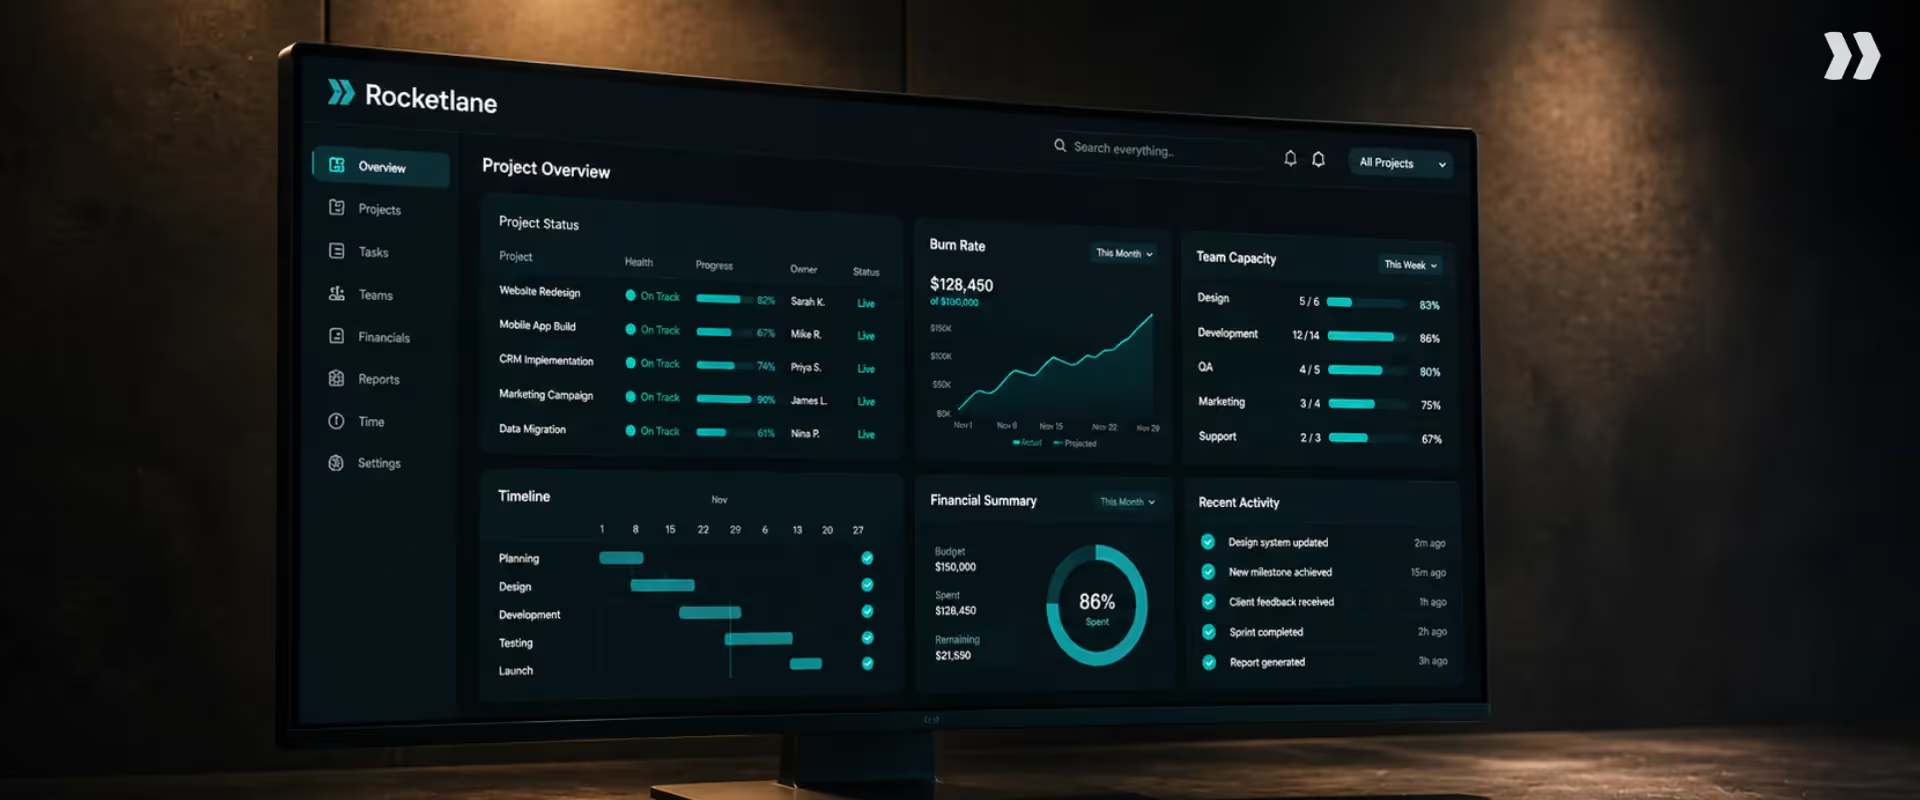
The infrastructure problem is solvable, but not by layering another reporting tool on the stack.
Purpose-built PSA platforms like Rocketlane replace the fragmented stack by unifying time tracking, resource allocation, and financials into a single execution layer. Integrated risk register and risk mitigation tools within Rocketlane also help teams proactively manage financial and delivery risks.
Rocketlane is the agentic execution platform 750+ PS teams use to track project burn rate in real time — at the project, phase, task, and resource level — with a 94% G2 recommendation rate and a $60M Series C from Insight Partners (March 2026).
Built for the Outcome Era of professional services delivery, Rocketlane marks the shift from merely tracking work to actively executing it. No batch processing — real-time data flows from timesheet submission to financial dashboard without manual reconciliation.
1. Real-time financial dashboard at the project level
Most PS teams see their project's financial picture once a month, after finance closes the books.
By then, the team had already made the decisions that mattered. A connected PSA gives every project a dedicated financial tab. Live hourly, and revenue burn, budget consumption, and projected margin appear in real time.
Delivery leaders can answer "Are we on track financially?" during the client call.
2. Phase and task-level burn rate breakdown
Portfolio-level burn rate often looks healthy. The truth shows up only when you drill into the phase running at 140% of the budget. The rest of the project still looks fine.
Rocketlane’s financial dashboard lets delivery leaders drill from portfolio to project to phase to task. Teams see exactly where hours and costs concentrate.
Identify the workstream, phase, or resource driving the overrun before it cascades. Financial visibility becomes actionable, not only reportable. See unlocking resource allocation power.
3. Automated budget alerts at configurable thresholds
A burn rate alert at 100% budget consumption is an autopsy, not a warning. Configure alerts at 50%, 75%, and 90% consumption for both hour burn and revenue burn. Different stakeholders receive different alerts.
The PM sees the 75% warning. The VP of PS gets the 90% escalation. The platform notifies the client sponsor when a milestone budget is hit. The right people learn about budget risk with enough runway to act.
4. Multi-budget support for complex PS projects
Real PS projects do not have one budget. They carry an original scope, change orders, a T&M retainer, and a fixed-fee go-live milestone. Most tools cannot track all of these coherently in one place.
Each project supports multiple budgets, each with its own billing model, revenue recognition method, and burn rate tracking.
Change orders stay separate from the original scope. Multi-budget tracking integrates with resource planning, so teams see capacity and cost together as the project progresses.
Burn rate data remains accurate across complex, multi-budget engagements without manual reconciliation. See resource planning and forecasting.
5. Resource allocation with live cost rate visibility
Teams do not erode margin maliciously when staffing. They make those decisions without cost rate information at the moment of allocation.
Allocating a resource shows the cost rate, forecasted utilization impact, and projected margin effect up front.
All three appear before the PM confirms the allocation. Staffing decisions balance delivery quality with margin protection. The people closest to the work make the call.
6. Invoicing connected to project financial data
Delayed invoicing is rarely a process failure. It is a data failure. Invoices stall because nobody can confirm what the team delivered or what is billable.
Invoicing flows directly from project data: time tracked, milestones completed, expenses submitted. Invoice generation drops from 7 days to 1-2 days post-close.
The platform syncs with QuickBooks, NetSuite, and Xero. Faster invoicing means faster cash collection, with a financial picture that both accounting and delivery trust. See introducing invoices in Rocketlane.
Teams using Rocketlane’s financial management report invoice generation dropping from 7+ days to 1–2 days, margin improvements of 10–15 percentage points, and a 50–70% reduction in manual reconciliation time. See the capacity planning dashboard visibility.
How Rocketlane Nitro transforms burn rate management
Real-time dashboards tell you what is happening.
Rocketlane Nitro embodies the shift from merely tracking work to actively executing it, preventing what should not happen, and catching what human oversight misses. Nitro changes the burn rate governance equation by shifting it from a PM habit to a system behavior.
The four agents address the most common burn rate failure modes. They cover timesheet noise, project drift, conversation-stage scope creep, and reporting bottlenecks. With its proactive features, Rocketlane Nitro helps teams maximize project success by preventing common burnout pitfalls. See Vibe PS reimagining services.
Relevant Nitro Agents for burn rate management:
How does AI change burn rate management for PS teams?
AI changes the way burn rate is managed by shifting it from a monitoring function to a prevention function. Instead of reviewing burn rate reports after the fact, AI agents enforce timesheet policies at the point of entry.
They detect signals of scope creep from client conversations in real time. They flag resourcing decisions that will erode margin before confirmation.
The result is burn rate governance that operates continuously: not weekly, not monthly, but at the moment of decision. See AI and automation in services.
Timesheet Policy Agent: clean data, accurate burn rate
Burn rate accuracy depends on timesheet quality. Non-billable hours on billable codes, time on closed tasks, and entries without notes corrupt the financial picture. The Timesheet Policy Agent enforces time entry rules at submission, not at approval.
It blocks policy violations, flags hours beyond allocated effort, and requires notes on entries above budget.
When a consultant logs 9 hours against a task budgeted for 6, the agent surfaces the variance immediately.
The PM approves with context or redirects the hours to another budget. Burn rate data, finance, and delivery all trust, because the platform governs inputs at entry. The data correction shifts from Monday morning to the moment of submission. See 2026 PS automation trends.
AI Analyst: burn rate intelligence on demand
A VP of PS managing 80 projects should not have to run 80 reports to find financial risk. The AI Analyst answers in plain language.
Ask "Which projects have burned more than 60% of the budget but delivered less than 50% of the scope?" Or "Show me projects with a projected margin below 15%."
The AI Analyst surfaces the answer ranked by exposure, with the primary driver of overrun for each. A Friday afternoon’s work becomes a 90-second conversation. Executive-ready burn rate intelligence is available to anyone with access. See balancing automation and humans.
Signals Agent: scope creep detection before it burns budget
Scope creep is a burn-rate problem that starts in a client conversation, not on a timesheet. By the time the hours appear in the burn rate report, the work is done. The change order window has closed.
The Signals Agent monitors client calls and emails for language indicating scope expansion. It captures new requirements, informal agreements, and timeline extensions that arise in conversation. It flags them before they are logged as hours and creates a PM task to assess change-order eligibility.
Teams catch scope creep at the conversation stage, not the timesheet stage. Change order conversations happen proactively, not apologetically.
See Nitro's financial governance agents in action. [Book a demo]
Key takeaways:
- Understanding and monitoring project burn rate is crucial for effective project delivery.
- Adopting structured frameworks and tools helps maintain control and ensures successful outcomes.
What to know before you buy Rocketlane
Rocketlane, the agentic execution platform trusted by 750+ customers and backed by a 94% G2 recommendation rate, gives PS teams real-time visibility into burn rate at the project, phase, and resource levels.
PS leaders evaluating Rocketlane raise the same four concerns. Here is the honest counter on each before you talk to sales.
- Rocketlane looks expensive vs. our current stack: The relevant comparison is TCO, not list price. Teams replacing a Monday + Harvest + spreadsheet stack typically see a 510 percentage point margin lift from tighter burn rate governance, $250–500K of recovered margin per year on a $5–10M services portfolio. That offsets the platform cost in the first quarter.
- Our finance team needs custom reporting so we won't get out of the box: Nitro's AI Analyst answers portfolio-level financial questions in natural language, "Which projects have burned more than 60% of budget but delivered less than 50% of scope?", without a BI build. Custom dashboards remain available for the edge cases.
- The learning curve will slow down my PMs: Rocketlane ships a playbook library with pre-built templates for implementation, onboarding, and recurring delivery engagements. New PMs are productive within days, not weeks, because the structure is already in place.
Isn't Rocketlane just an onboarding tool? Rocketlane is a full PSA platform: project execution, resource management, time tracking, multi-budget financials, invoicing, and AI governance via Nitro. Customer onboarding is one workflow it supports, not the scope of the product. No batch processing, real-time data feeds for every decision.
See how PS teams protect margins with real-time burn rate governance → Book a 30-minute walkthrough
Table of Contents

Regsiter for the live webinar


Great consultants didn't join your team to spend Fridays writing documentation.
Table of contents
18 of Forbes Cloud 100 chose Rocketlane. The best PS teams aren't waiting around.
FAQs
What is project burn rate?
Project burn rate is the rate at which a project consumes its allocated budget or hours over a given period. In professional services, it tracks hourly burn and revenue burn together to signal whether margins will hold. Hourly burn measures team hours used against the plan. Revenue burn measures the consumption of financial budget based on billable time and cost rates.
How do you calculate project burn rate?
The basic project burn rate formula is: Burn Rate = Total Amount Spent ÷ Time Elapsed. This burn rate calculation gives the average spend per time period. Professional services teams typically calculate it weekly or monthly. They compare the actual rate against the planned spend to spot variance early. To get a percentage of the budget, use (Total Spent ÷ Total Budget) × 100. For projection, use Total Spent ÷ Percentage of Work Complete.
What is a good burn rate for a project?
A healthy project burn rate keeps budget consumption within 5 percentage points of the scope completion percentage. On a fixed-fee project, budget consumption running 10 points ahead of scope-delivered signals an immediate review. For T&M projects, a healthy burn rate keeps billable hours above 85% of total logged hours. The right benchmark depends on billing model, project phase, and margin targets.
What is burn rate in project management, PMP?
In the PMP methodology, Earned Value Management expresses burn rate as a ratio. The formula is: Burn Rate = Actual Cost (AC) ÷ Budgeted Cost of Work Performed (BCWP). A result above 1.0 indicates the project is spending more than it generates. That ratio signals budget overrun risk. PMP burn rate analysis connects financial performance to scope delivery with a single metric.
What is the difference between a burndown chart and a burn rate chart?
A burn rate chart plots actual spend against planned spend over time. A burndown chart tracks remaining work or budget toward zero as tasks complete. Burn rate charts are primarily financial tools, while burndown charts track work completion. Burn rate charts are more useful for profitability management. Burndown charts are more common in agile sprint tracking













Copyright © 2026 Rocketlane Corp. All rights reserved.



















.webp)