

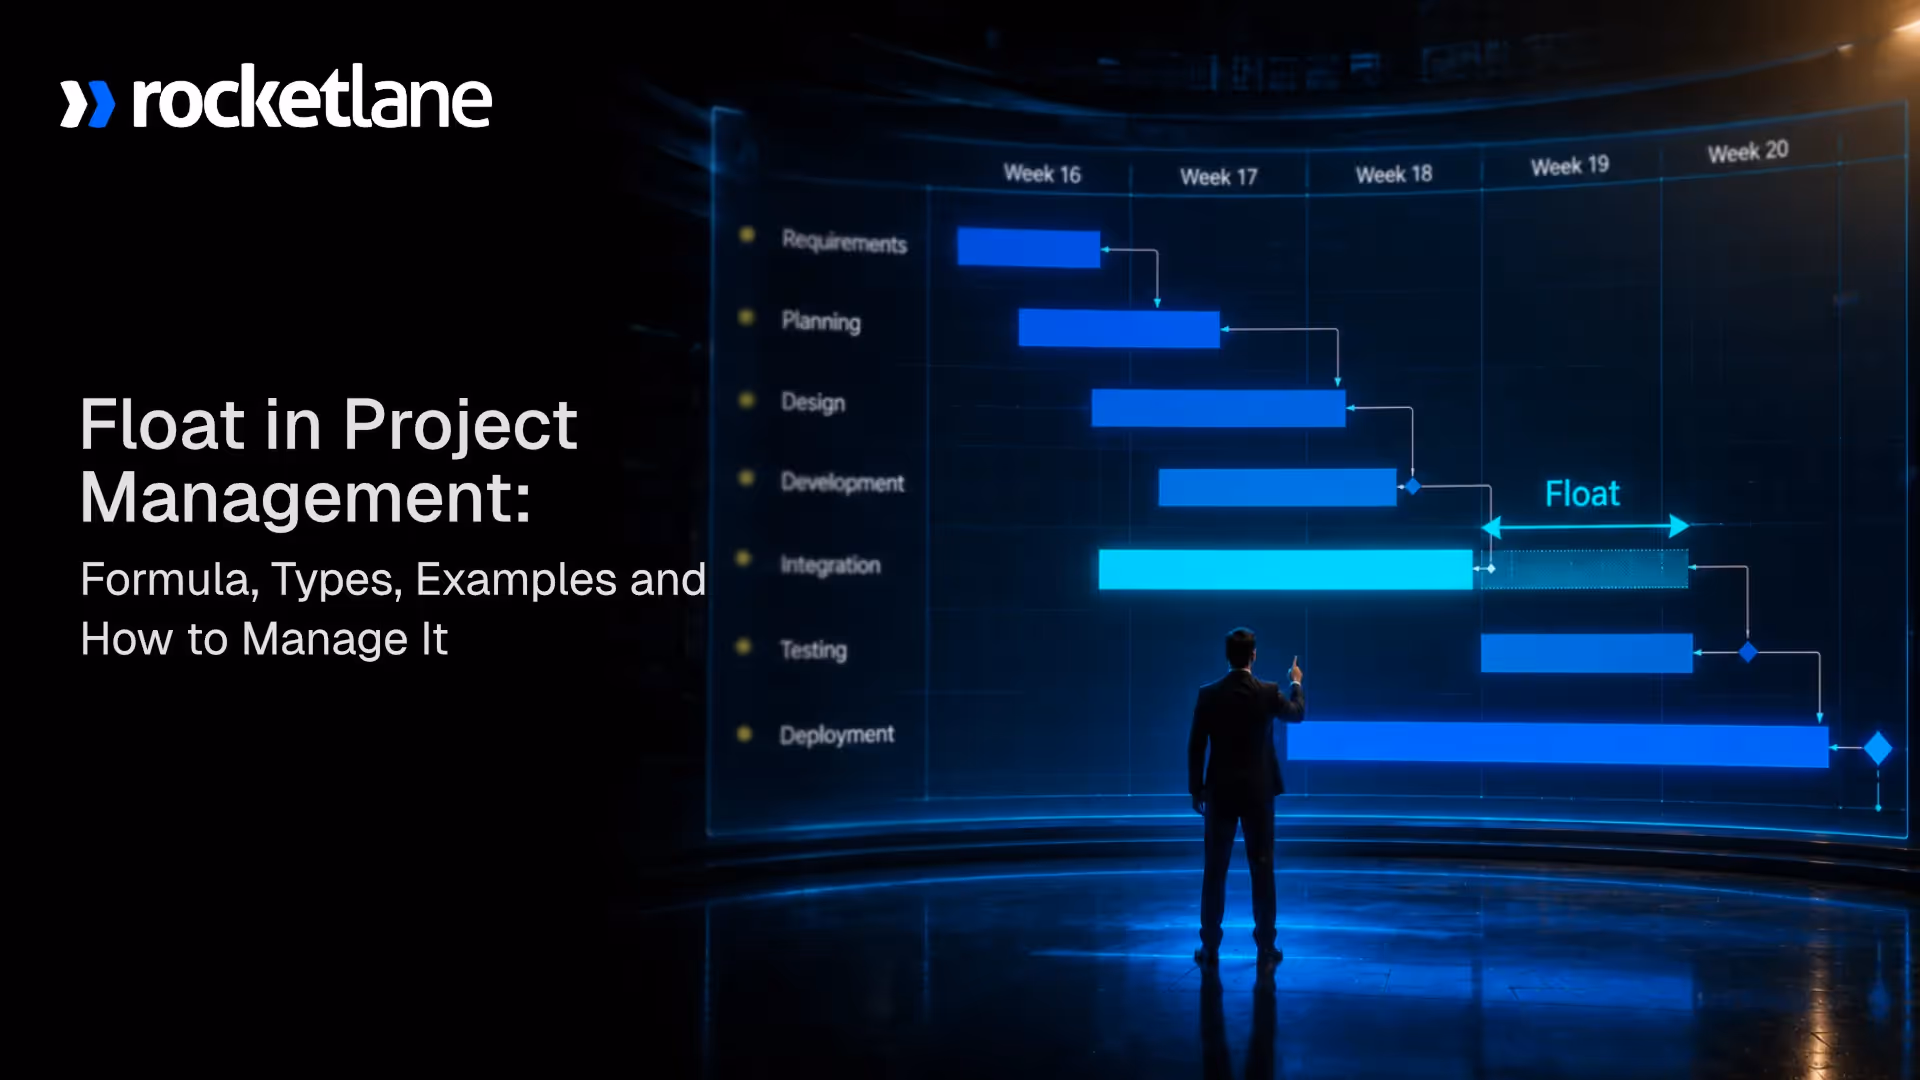

When a project slips, the first question is always the same: "Why didn't we see this coming?" The answer, most of the time, is float. Not a lack of it, but a failure to watch it.
Float in project management is the amount of time a task can be delayed without affecting the project completion date or the schedule of dependent tasks.
It exists in every project schedule, but most teams check it once during planning and then ignore it.
By the time negative float shows up in a report, the timeline has already collapsed, the billing milestone has shifted, and the customer is already frustrated.
For professional services and implementation teams, this is not just a scheduling inconvenience. Timeline slippage erodes margins.
Delayed milestones push invoice dates. Reactive firefighting consumes the billable hours that were supposed to drive delivery. Delivery leads who treat float as a live execution signal, not a static planning output, catch these problems weeks before they become crises.
They allocate resources to what actually matters. They keep project timelines intact without constant firefighting. And they can show a customer exactly what their delay costs the project schedule, in hard numbers, not guesswork.
Most teams fail at this not because they lack discipline, but because the tools they use were not built for real-time float tracking across concurrent customer-facing implementations.
This guide covers everything you need to know: definitions, formulas, types of float, worked examples, float analysis techniques, and how high-performing services teams use float to run tighter, more predictable delivery operations.
What is float in project management, and how does it work?
Float in project management is the amount of time a task can be delayed without affecting the project completion date or the start of dependent tasks.
It is a direct output of the critical path method (CPM) and represents the scheduling flexibility available within a project plan at any given moment.
Float in project management refers to a measurable buffer, not an informal cushion. Float is not spare time that the team fills with low-priority work.
It is not a permanent reserve. It shows exactly how much scheduling room exists right now, and that number shifts as tasks are completed, delayed, or reprioritized throughout the project lifecycle.
When a task has 5 days of float, the team has 5 days before that task's delay starts affecting something else in the schedule.
When a task has zero float, it sits on the project's critical path, and any delay, even by a single day, moves the project's final completion date by the same amount. When a task shows a negative float, the project is behind schedule and requires active correction.
Here is what that looks like in practice. A software implementation project has two parallel workstreams running after kickoff: customer configuration and data migration.
The configuration phase carries 4 days of total float because it does not directly feed the go-live milestone. The data migration task has zero float because every other go-live dependency waits on it.
An implementation manager who knows this prioritizes the data migration team first and adjusts the configuration schedule only if resources run short. Without float visibility, both tasks look equally urgent, and the wrong call creates a delay that nobody saw coming.
Float is also called slack or schedule float across different methodologies. Those terms are interchangeable. Some teams also use "float time in project management" or "task float" to distinguish it from other scheduling concepts. Regardless of the label, it means the same thing: scheduling flexibility that either exists or does not, and that requires active tracking to use well.
What is the difference between float, slack, and lag in project management?
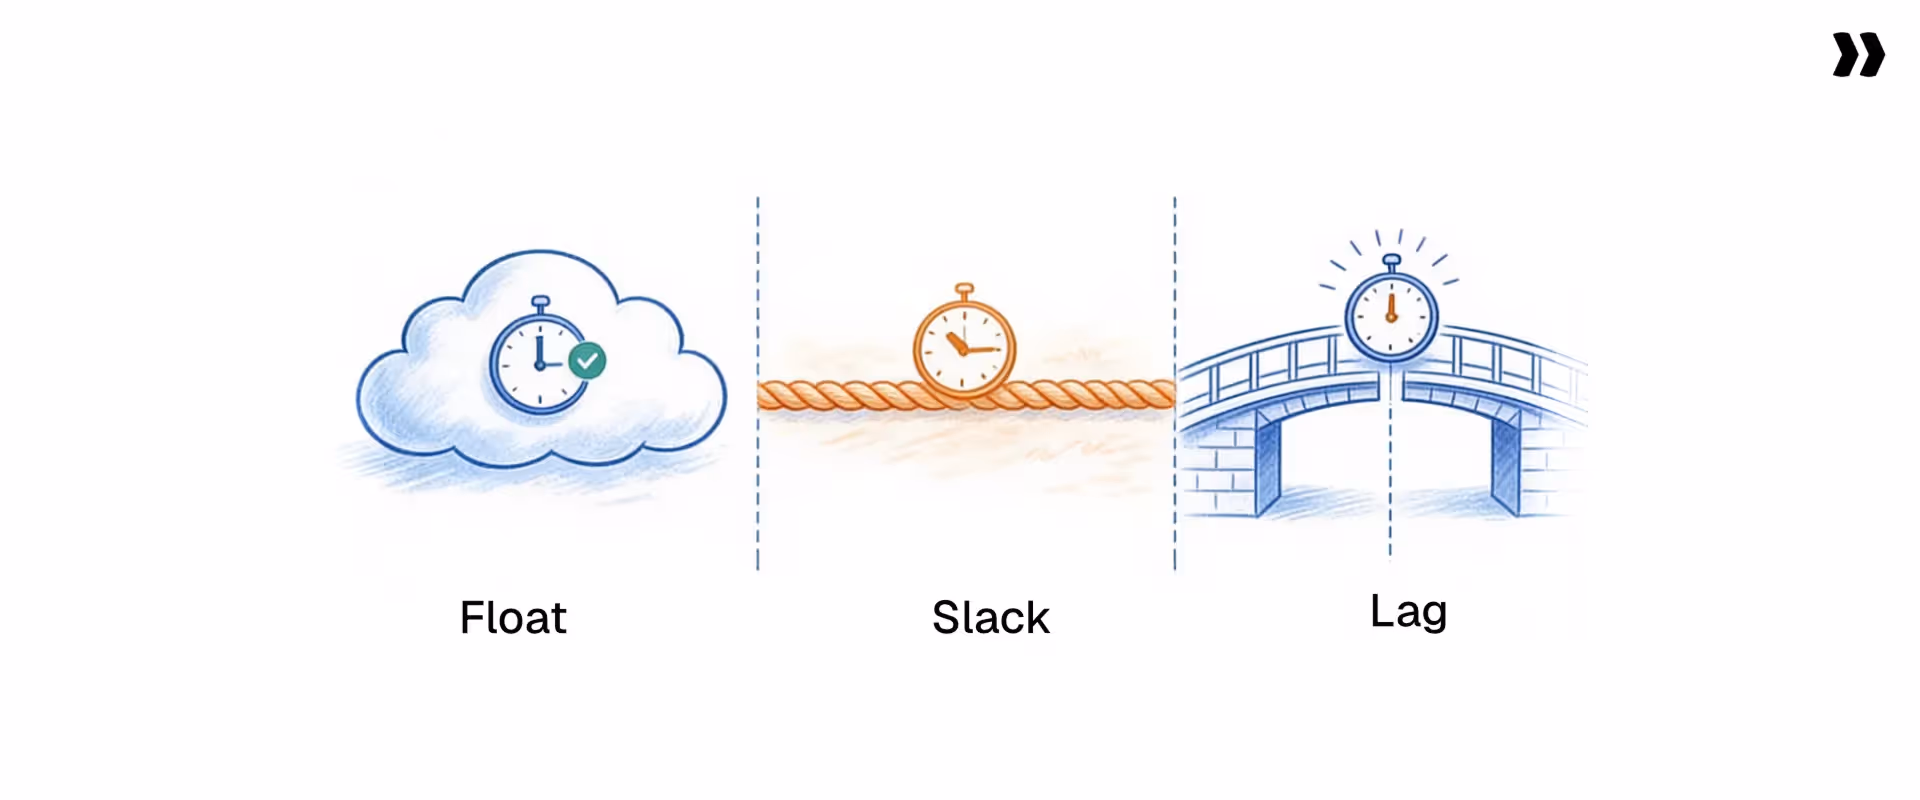
Slack and float mean the same thing. Both describe the scheduling flexibility available to a task or project.
The Project Management Body of Knowledge uses both interchangeably, and different teams, industries, and tools adopt one term or the other based on convention. The difference between slack and float in project management is purely terminological. A task with 3 days of slack has 3 days of float.
Lag is a different concept entirely. Lag is an intentional delay built into a dependency between two tasks.
If Task B cannot start until 2 days after Task A finishes, that 2-day gap is a lag. It is a planning decision, not a scheduling outcome produced by CPM calculations.
Float vs lag in project management is a meaningful distinction: lag shapes dependencies before float is calculated. Float measures the outcome of those dependencies.
Why does float matter in project management?
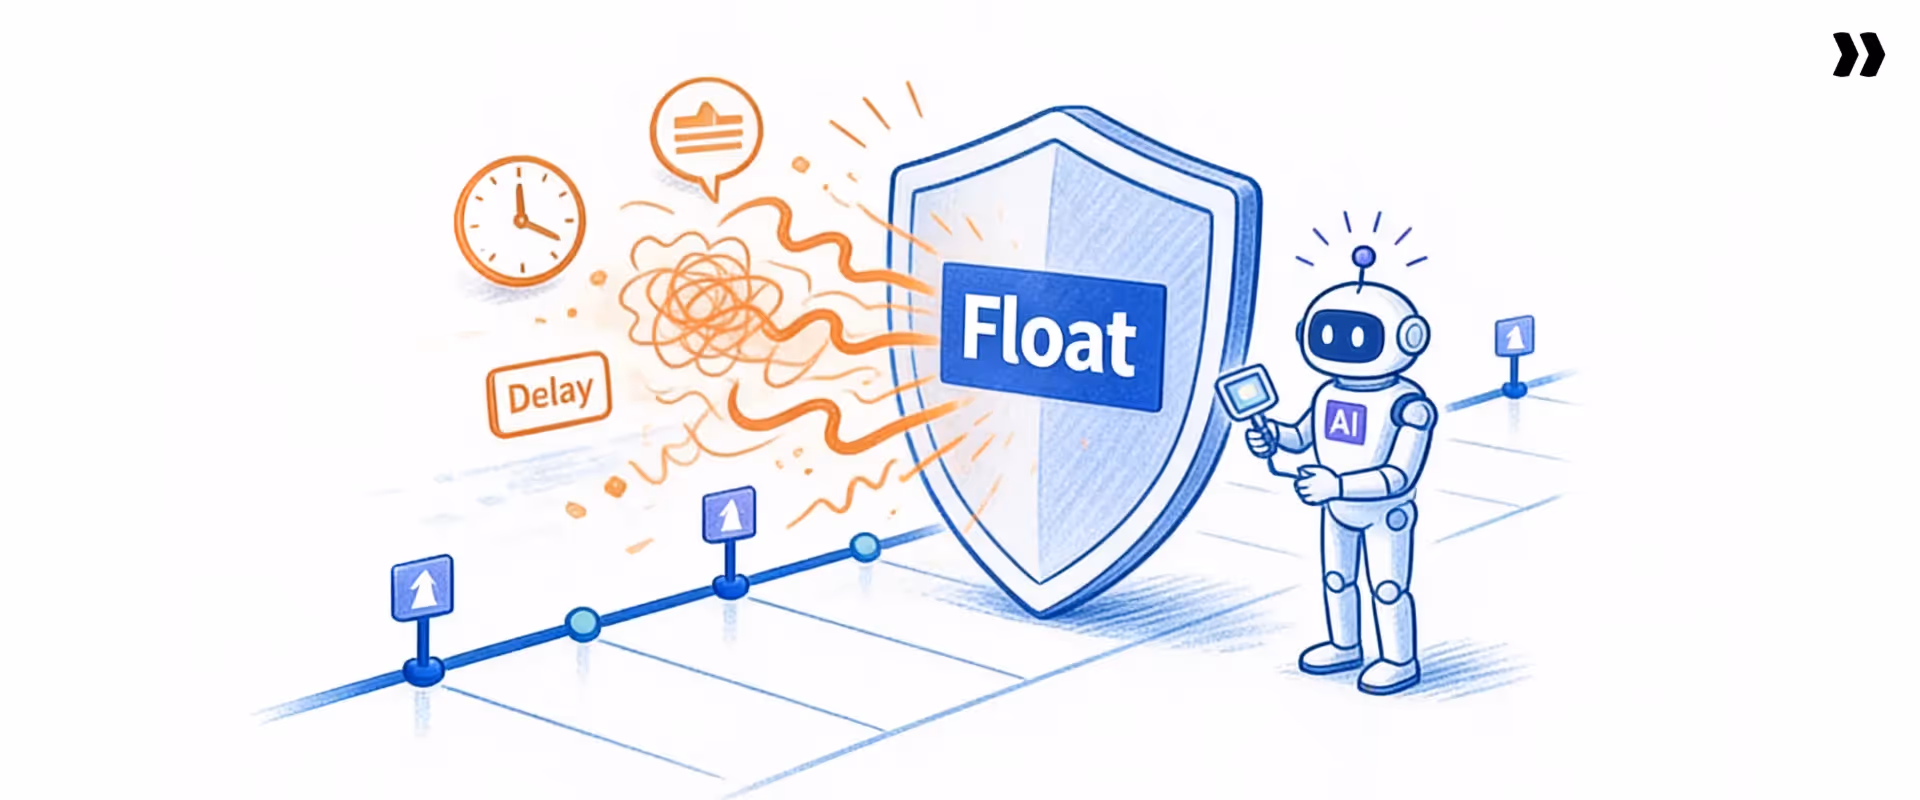
Float determines whether a project absorbs disruption or gets overwhelmed by it.
Every project encounters delays. A customer takes longer to provide approvals. A team member gets reassigned to a higher-priority engagement. A vendor delivers late.
None of these events need to affect the final completion date if the affected tasks carry enough float. But when teams do not know where a float sits in the schedule, every delay triggers a crisis, and every crisis forces reactive schedule changes that compound over time.
The importance of float in project management comes down to five operational realities for professional services and implementation teams:
- Schedule risk visibility. Float analysis reveals which parts of a project schedule carry risk and which carry flexibility. Delivery leads who track float consumption see risk building before deadlines are missed, rather than discovering it only after.
- Resource allocation accuracy. High-float tasks absorb resource reallocation without timeline impact. Moving a resource from a high-float task to a critical path task keeps the project on schedule while maintaining workload balance across complex projects.
- Customer accountability. When a customer delays a required input, float data shows exactly how that delay affects the project's final completion date. This replaces guesswork in escalation conversations with scheduled evidence, and it removes the awkwardness of telling a customer their delay caused a problem without being able to show them the math.
- Utilization efficiency. Teams that manage floats dynamically avoid two common traps: over-allocation on non-critical work and under-allocation on critical tasks. Both problems erode project margins and delivery predictability.
- Margin protection. When a float is managed actively, resources move to critical work at the right time. Idle time on non-critical tasks shrinks, billable utilization rises, and projects close on the schedule they were scoped against. Margin leakage from timeline slip and resource misallocation becomes visible before it is too late to correct.
For professional services teams running 20 to 100 concurrent implementations, float is not just a scheduling concept. It is a direct lever for margin protection and delivery predictability that siloed tools and manual tracking cannot support at scale.
What are the different types of float in project management?
The different types of float in project management are total float, free float, independent float, interfering float, project float, zero float, positive float, and negative float.
Each represents a different scope of scheduling flexibility and carries different implications for how delivery teams interpret schedule data and respond to delays.
Total float
Total float in project management is the amount of time a task can be delayed without affecting the project's final completion date. It is the most widely used float metric and the primary output of a CPM analysis. When someone asks "how much float does this activity have?" They are asking for a total float.
Total float is shared across a dependency chain. If three tasks share 5 days of total float, using all 5 days on the first task leaves none for the other two.
Free float
Free float in project management is the amount of time a task can be delayed without affecting the early start of any subsequent task. Unlike total float, free float belongs to a single task. Using it does not reduce the float available to predecessor or successor tasks.
Free float is the safer metric for individual task scheduling decisions. A task with 2 days of free float can slip by 2 days with zero downstream effect, regardless of what the rest of the schedule looks like.
Independent float
Independent float represents the delay a task absorbs in the worst-case scenario: all predecessor tasks finish as late as possible and all successor tasks need to start as early as possible.
An independent float is rarely large, but when it exists, it represents scheduling flexibility that truly belongs to that task alone, with no dependency on how the rest of the schedule behaves.
Interfering float
Interfering float is the portion of total float that, if used, delays the start of at least one successor task without affecting the project completion date. It equals total float minus free float. Using an interfering float does not push the final deadline, but it does shift downstream task timing and affects coordination across the team.
Project float
Project float is the buffer between the project's planned completion date and the contractual or customer-committed deadline. If a project is scheduled to finish 10 days before the contract date, it carries 10 days of project float. This is separate from task-level float and represents the organization's scheduling cushion on a given engagement.
Zero float
Zero float means no delay tolerance exists. Tasks with zero float sit on the project's critical path. Any delay to a zero-float task shifts the project completion date by the same number of days. These tasks require the highest level of daily management attention in every active project.
Positive float
Positive float simply means a task carries some scheduling flexibility, whether at the task level (free float) or the project level (total float). Most tasks in a well-constructed project schedule carry positive float. The work of float management is knowing how much each task has and how fast that number is changing.
Negative float
Negative float in project management means the project is already behind schedule. A task with a negative float cannot meet its deadline even if it starts immediately. Negative float appears when task durations, dependencies, and deadlines combine to make the current schedule mathematically impossible.
When negative float surfaces, the team has three options: compress task durations, fast-track by running tasks in parallel, or reset the deadline with the customer.
How do you calculate float in project management?
Calculating float in project management requires running the forward pass and backward pass of the critical path method. The forward pass determines the earliest possible start and finish times for each task.
The backward pass determines the latest allowable start and finish times without affecting the project completion date. Float is the difference between those two sets of values.
If a task has an early start of Day 3 and a late start of Day 8, total float equals 5 days. The task starts up to 5 days later than its earliest possible point without pushing the project completion date.
If the current task finishes on Day 10 and its successor has an early start of Day 13 with no lag, free float equals 3 days. Delaying the current task by 3 days produces no downstream effect on when the successor task starts.
This calculation uses the most restrictive values at both ends: successors starting as early as possible and predecessors finishing as late as possible. The result is the float that belongs entirely to that particular task regardless of how the rest of the schedule behaves.
Activity float in project management uses the same forward and backward pass logic as total float. The term "activity float" refers to the float calculated for a specific activity within the project network diagram. The float formula in project management for activity float is:
To calculate total float, free float, or activity float accurately, delivery teams need three things: accurate task durations, complete dependency mapping, and a defined project deadline. Any gap in these inputs produces misleading float values.
Worked example: how to calculate float time step by step
Task network: Four tasks in a parallel dependency structure.
Forward pass (earliest times):
- Task A: Early start Day 1, Early finish Day 3
- Task B: Early start Day 4, Early finish Day 8
- Task C: Early start Day 4, Early finish Day 7
- Task D: Early start Day 9 (must wait for both B and C), Early finish Day 11
Backward pass (from project deadline Day 11):
- Task D: Late start Day 9, Late finish Day 11
- Task B: Late start Day 4, Late finish Day 8
- Task C: Late start Day 5, Late finish Day 8
- Task A: Late start Day 1, Late finish Day 3
Float results:
- Task A: Total float = 1 minus 1 = 0. Critical path.
- Task B: Total float = 4 minus 4 = 0. Critical path.
- Task C: Total float = Late finish minus Early finish = 8 minus 7 = 1 day. Free float = Early start of D minus Early finish of C = 9 minus 7 = 2 days.
- Task D: Total float = 9 minus 9 = 0. Critical path.
Task C carries 1 day of total float and 2 days of free float. Tasks A, B, and D sit on the project's critical path with zero float.
Teams using this approach identify critical path shifts significantly earlier than teams relying on static planning data, which translates into fewer escalations, more consistent on-time delivery, and projects that close on the margins they were scoped against.
What is the Active Float Management Model and how does it work in delivery?
The Active Float Management Model is a four-layer operational approach that transforms float from a one-time planning calculation into a live execution control mechanism.
Most project management methodologies calculate float during planning and leave it there.
The Active Float Management Model treats float as a signal that requires continuous monitoring, threshold-based escalation, resource-responsive adjustment, and portfolio-level pattern recognition throughout the entire project lifecycle.
This framework applies specifically to professional services and implementation teams managing concurrent complex projects with shared resources, where static float data creates false confidence and dynamic float tracking creates real schedule control.
- Layer 1: Continuous float calculation: Float values update in real time as tasks are completed, delayed, or reprioritized. Any change to task duration or dependency logic triggers a recalculation across the entire dependency chain. This layer requires either disciplined daily manual updates or a scheduling platform with automated dependency tracking built in.
- Layer 2: Float consumption monitoring: The team tracks not just the current float value but the rate at which float is being consumed. A project that started with 10 days of total float on its critical path and now shows 3 days, halfway through the schedule, burns float faster than planned. That consumption rate is a leading indicator of schedule risk, not a lagging one. It gives delivery leads time to act before the margin impact is locked in.
- Layer 3: Escalation thresholds: Each project defines a float threshold. When total float drops below that threshold, the system triggers an escalation to the implementation manager or delivery lead. Thresholds vary by project type and risk tolerance. A 3-week onboarding engagement sets a threshold at 2 days. A 6-month enterprise rollout sets it at 10 days. The specific number matters less than having one and enforcing it consistently.
- Layer 4: Portfolio-level float patterns: Across multiple concurrent projects, float data reveals systemic problems that single-project analysis misses. When 60% of projects show critical float erosion in the same project phase, the issue is not individual execution quality. It is a process or resourcing problem that requires a structural fix, not a per-project escalation.
When teams skip Layer 2, float consumption monitoring, they manage projects by asking whether tasks are completed on time rather than whether the schedule is under stress.
These teams frequently report no issues right up to the final two weeks, when a cascade of delayed tasks surfaces all at once and the project completion date shifts without warning.
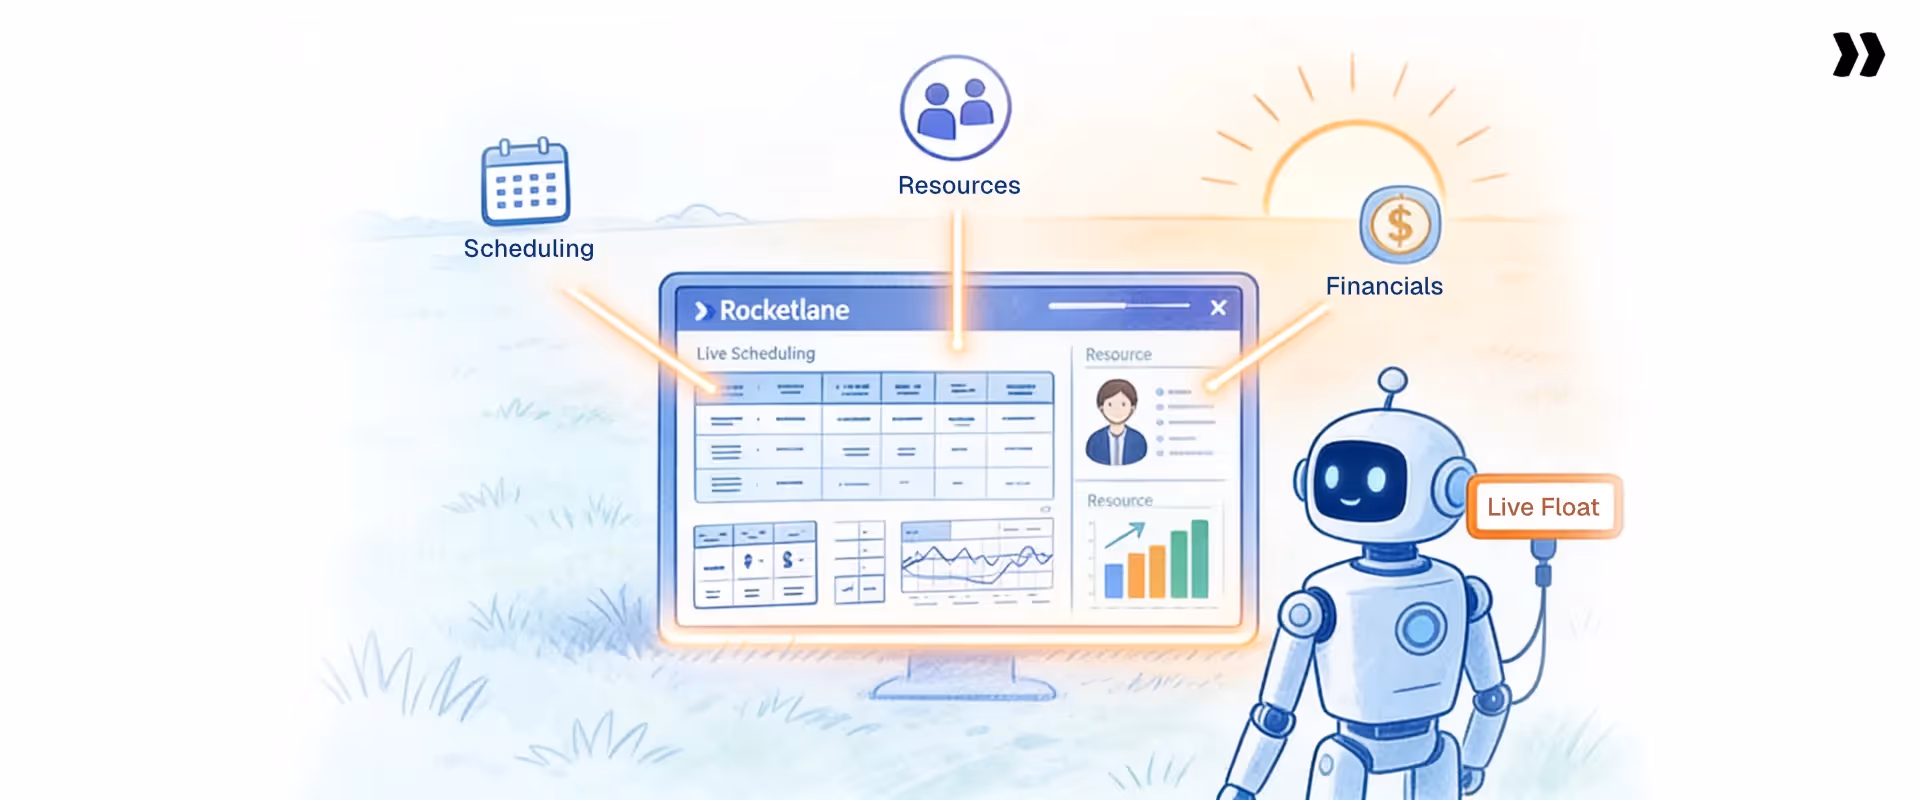
Making this model operational requires a platform that connects scheduling, resource management, and project financials in one system. Generic project management tools track tasks.
They do not connect float visibility to resource allocation or billing workflows, and they do not surface patterns across a portfolio of concurrent projects. That gap is exactly where float management breaks down for services teams operating at scale.
How does float analysis in project management turn schedule data into decisions?
Float analysis is the process of examining float values, consumption trends, and critical path behavior to identify schedule risks and drive execution decisions before those risks turn into missed deadlines.
Most teams use float as a binary check: is the task on the critical path or not? Float analysis in project management goes further. It examines how fast float is being consumed, which tasks are approaching zero float, and whether the critical path has shifted since the last baseline was set.
Float consumption tracking
Float consumption measures how much of the original buffer has been used at any point in the project. A task that started with 8 days of total float and now shows 3 days has consumed 5 days of its buffer. If the project is only 30% complete, that consumption rate signals risk long before any deadline shows as immediately at risk.
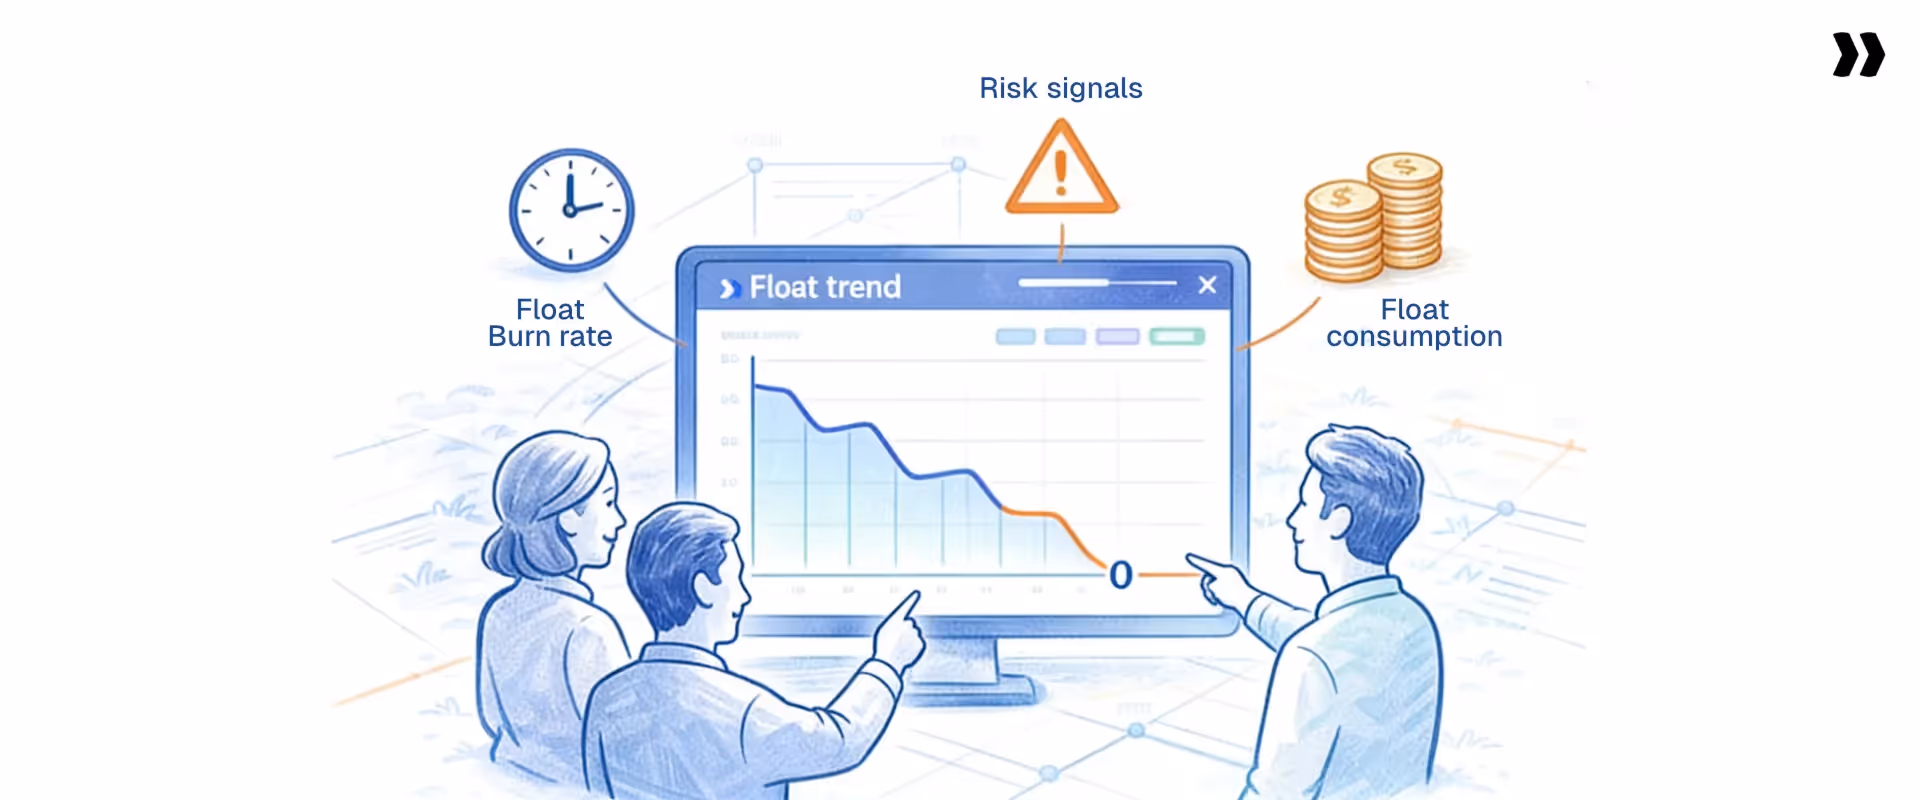
Float burn rate
Float burn rate compares actual float consumption against expected consumption at the current project stage. A project that is 50% complete but has consumed 80% of its total float is burning float faster than planned. This is a forward-looking warning that the schedule needs intervention, not a report of past failure.
Float risk signals
Three float conditions require immediate attention from delivery leads:
- Rapid reduction in total float across multiple tasks in the same project phase, suggesting a broader resourcing or sequencing problem
- Critical path expansion, when tasks that previously held positive float drop to zero float and join the critical path
- Emergence of negative float, indicating that the current schedule is no longer achievable without deliberate changes to scope, resources, or deadlines
Schedule float in portfolio management
Managing schedule float across a portfolio of concurrent projects reveals coordination gaps that individual project analysis cannot detect. When 10 active projects all show float erosion in the same two-week window, resource contention across those projects is the likely cause.
Float data at the portfolio level guides staffing decisions, project start date adjustments, and capacity planning in a way that single-project dashboards never could. For professional services organizations, this portfolio-level visibility is the difference between scaling delivery operations and scaling headcount to keep up.
Float analysis is the difference between managing a project and actively managing a project schedule. That distinction matters most in complex projects with dense dependency structures and shared resources across multiple concurrent customer engagements.
How do you use float in real projects: a step-by-step workflow?
Float becomes operationally valuable only when implementation and delivery teams build it into daily execution decisions. The following workflow converts float analysis from a concept into a repeatable practice.
Step 1: Identify critical and low-float tasks
At the start of each week, pull current float values for all active tasks. Classify tasks into three tiers: zero float (critical path), low float (below the defined threshold), and sufficient float. Direct daily attention to the zero and low-float tiers first.
This classification shifts the weekly planning conversation from "what is everyone working on?" to "what does the schedule actually need from us right now?"
Step 2: Reallocate resources based on float priority
When a critical path task needs more capacity, look at team members assigned to high-float tasks. If someone on a task with 8 days of float can contribute to a critical task without disrupting the high-float work, that reallocation is schedule-safe.
It keeps the project on track without requiring additional headcount, which protects margins on fixed-fee and time-and-materials engagements alike.
Dynamic resource reallocation based on float data produces better utilization on work that matters and protects project timelines without adding cost.
Step 3: Monitor float consumption daily
Check float values at the task level every day, or at minimum every other day in the final 30% of the project schedule. Float erodes fastest near the end of a project, when dependencies stack up and early delays compound. Daily monitoring in this phase catches critical path shifts while time remains to respond.
Step 4: Set and enforce escalation thresholds
Define the float threshold below which a task triggers an escalation. Communicate that threshold to the team so they understand why an alert fires before a task is overdue. Early escalation on low-float tasks prevents the reactive firefighting that always follows missed deadlines.
Step 5: Rebalance schedules before delays cascade
When float consumption signals an approaching problem, adjust the schedule before the delay occurs. Push non-critical tasks to create resource availability for critical ones. Compress task durations through additional resources or parallel execution. Reset dependencies if the original sequencing no longer reflects project reality.
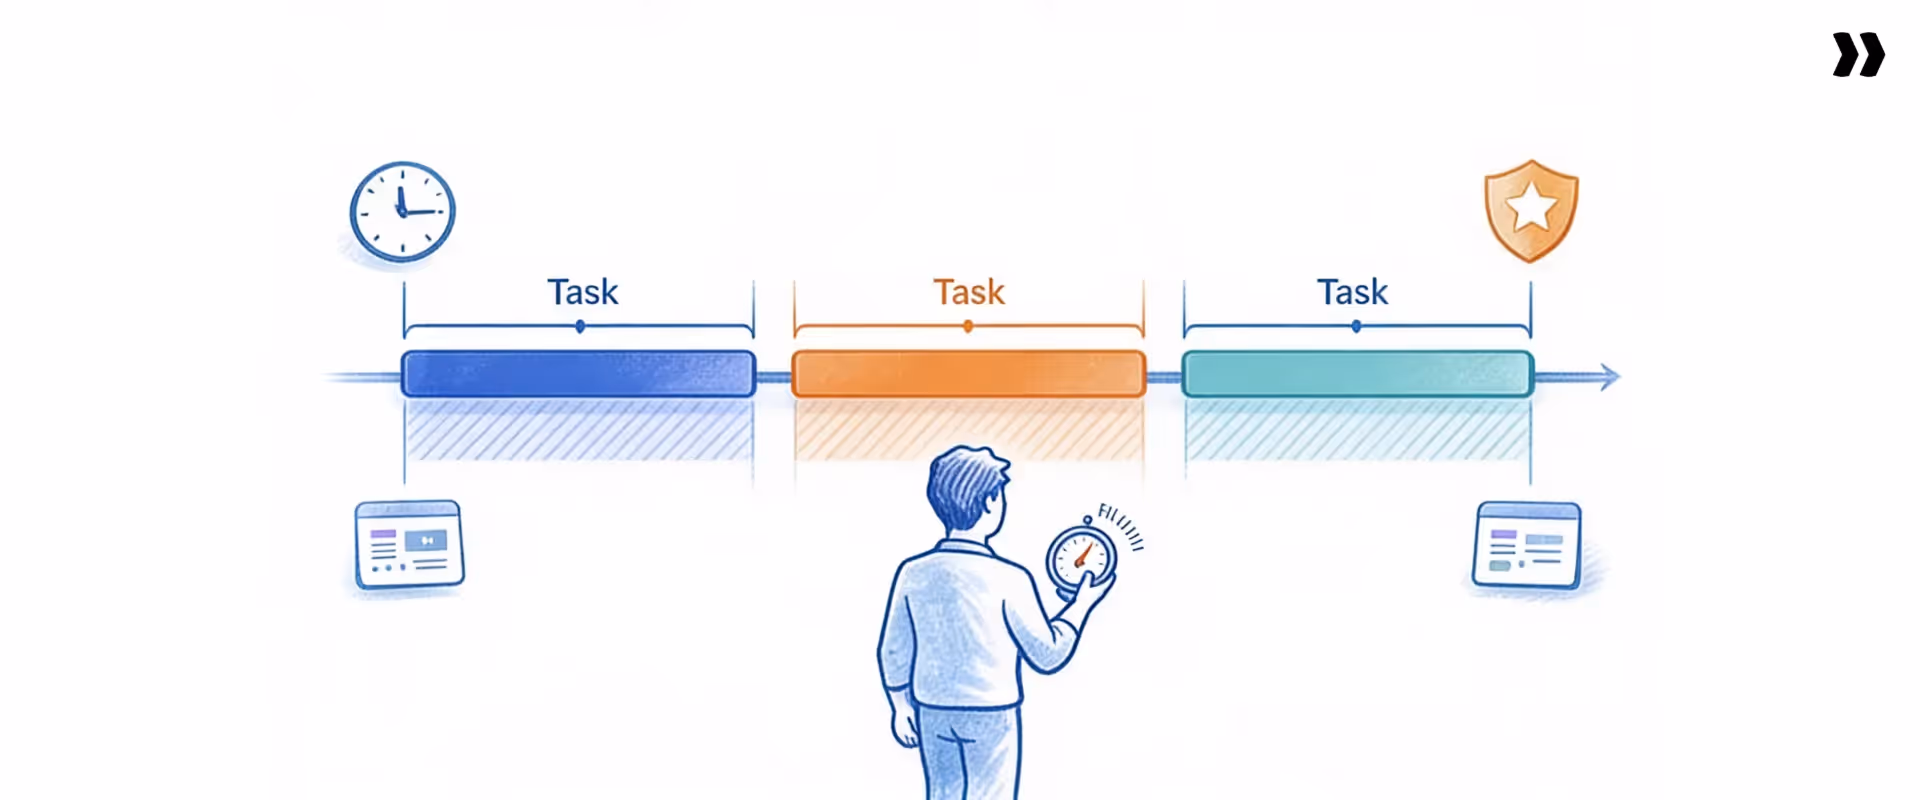
What does float look like in a multi-task project management example?
This example walks through a scenario showing how float is calculated and how different delay sizes interact with the critical path.
Project scenario: Software onboarding implementation with 4 tasks.
- Delay scenario 1: Task C is delayed by 1 day. Task C has 1 day of total float. The delay is absorbed entirely. Task D still starts on Day 9. Project completion date holds at Day 11.
- Delay scenario 2: Task C is delayed by 2 days. Task C now finishes on Day 9. Task D cannot start until Day 10. Project completion date shifts to Day 12. One extra day was lost because the float was exhausted and then exceeded by 1 day.
- Delay scenario 3: Task B is delayed by 1 day. Task B has zero float. Task D cannot start until Day 10. Project completion date shifts to Day 12 immediately, with no buffer to absorb even a single day's slip.
The same 1-day delay produces different outcomes depending on which task it hits. Task B's 1-day delay costs the entire project 1 day.
Task C's 1-day delay costs nothing. Without float data, both tasks look equally urgent, and misallocating management attention is almost guaranteed.
Why do most teams fail at managing float?
.avif)
Most teams calculate the float once and stop. The calculation happens during project planning, gets recorded in the schedule, and then sits untouched while the project runs. Dependencies shift. Tasks finish early or late.
Resources move to other projects. But the float values in the plan do not update to reflect any of this.
By the time someone checks the float again, the values are stale, the critical path has shifted, and the window for proactive intervention has closed.
Core failure patterns
- Treating float as static: Float calculated on Day 1 does not reflect project reality on Day 30. Every task completion or delay changes float across the dependency chain. Delivery teams operating on Day 1 float values make decisions based on a schedule that no longer exists.
- Weak dependency mapping: Float is only as accurate as the dependency logic behind it. If the project plan shows tasks as independent when they are actually sequential, float calculations are wrong from the start. Incomplete dependency maps produce float values that give false confidence about schedule health.
- No real-time updates: Manual schedule management creates lag between what is happening in the project and what the schedule reflects. By the time an implementation manager updates float values, the window for proactive action has already closed and the delay is already in motion.
- Disconnected tools: When project schedules live in one tool, resource allocations in another, and customer communications in a third, float signals never flow between the systems that need them. A resource pulled from a project to cover an urgent escalation elsewhere does not automatically trigger a float recalculation in the original project.
- No escalation triggers: Teams that wait for tasks to go overdue before acting are reacting to floats that have already been exhausted. Without predefined thresholds, float data does not drive behavior. It just records what went wrong after the fact.
- Tools not built for services delivery: Most project management tools were designed for internal team task tracking, not for managing float across concurrent customer-facing implementations. They do not automatically recalculate floats when dependencies shift. They do not connect schedule changes to resource allocation or financial outcomes. And they do not provide portfolio-level visibility into which engagements are under schedule stress.
Delivery teams trying to manage floats in a generic task management tool are solving a real operational problem with a tool that was never designed for it.
These failure patterns compound. A team with weak dependency mapping, static float values, and no escalation triggers is effectively flying blind. The schedule shows green because nobody updated it, not because the project is healthy.
What do best-in-class teams do differently when managing float?
High-performing delivery teams treat managing floats as an operational discipline embedded in daily execution, not a planning exercise completed once at kickoff.
Best-in-class teams also use float data to hold better customer conversations. When a customer requests a change or delays a required input, the team does not estimate the impact.
They show it. "Your approval came 3 days late. That task had 1 day of free float. The completion date shifted by 2 days." That conversation is factual, not adversarial, and it holds customers accountable for their role in the project schedule without creating conflict.
The difference between these two columns is not just discipline. It is the platform underneath. When scheduling, resource allocation, and delivery financials sit in separate systems, the connections between float data, resource decisions, and billing outcomes require manual reconciliation.
That reconciliation does not happen fast enough to be useful. Best-in-class professional services teams run these operations through a unified PSA platform where float signals automatically reach the people and systems that need to act on them.
Platforms like Rocketlane (4.7 G2 rating, 94% G2 recommendation rate) are consistently rated highest in G2's professional services automation category for exactly this capability: connecting schedule float to resource decisions and financial outcomes in real time.
What are the KPIs and business impact of float management?
Float management produces measurable results across scheduling, financial, and operational dimensions. Professional services teams that track project management float actively see the following outcomes:
Poor float management creates financial problems, not just scheduling ones. When projects slip, invoice milestones shift.
When milestones shift, cash flow timing moves. For professional services organizations running 30 to 100 concurrent implementations, a systematic float management problem translates directly into revenue timing risk and margin erosion across the entire book of business.
The delivery predictability that customers and finance teams expect is impossible to sustain when float data lives in a spreadsheet that nobody is actively watching.
Why does your current scheduling approach break at scale?
Small teams managing 5 to 10 projects at once can work with manual float tracking and still deliver reasonably well. That approach breaks when project volume grows past a certain threshold
The breaking point looks the same across most professional services organizations: a resource conflict that was invisible in the schedule until a critical path task started slipping, or a customer escalation about a deadline that nobody in the delivery team knew was at risk.
GiThe root cause is always the same. Float data existed somewhere, but the tools could not surface it fast enough to act on it.
What should you look for in a float management tool?
Not all project management tools handle float the same way. Generic task management tools track completion status. A platform purpose-built for professional services and implementation teams needs to go further.
The right tool addresses six core operational requirements:
- Automated dependency tracking. The tool updates float values automatically when any task in the dependency chain changes. Manual recalculation does not scale past 20 concurrent complex projects.
- Critical path visualization. Delivery managers need to see which tasks carry zero float at a glance. Color-coded critical path views and configurable float threshold alerts make float data operationally usable in daily standups and weekly planning reviews.
- Real-time schedule updates. When a task is completed or delayed, the schedule adjusts immediately. The tool reflects what is actually happening in the project, not what was planned 6 weeks ago at kickoff.
- Resource-schedule integration. Float data and resource availability sit in the same system. When a resource moves off a task, the tool shows the float impact right away rather than requiring a separate calculation in a different system.
- Portfolio-level float visibility. The tool surfaces float patterns across all active projects, not just within individual project plans. Portfolio-level visibility is what separates reactive float management from truly proactive delivery operations.
- Financial integration. Float delays affect billing. When a project slips, milestone-based invoices shift. When resource allocation changes to protect the schedule, hours and margins change. A tool that does not connect schedule changes to project financials leaves delivery teams managing schedule and margin in separate systems, which means financial impact always shows up late and is harder to address.
Which team should use Rocketlane for float management?
What to avoid: Generic project management tools designed for internal team task tracking. These tools require manual float recalculation, do not surface critical path changes automatically, and treat scheduling, resource allocation, and financials as separate concerns with no shared data layer.
For professional services teams running concurrent customer-facing implementations, this separation is where float management breaks down every time.
Why Rocketlane is the best tool for Project float management?
Rocketlane is an agentic execution platform purpose-built for professional services and implementation teams. The shift from merely tracking work to actively executing it is exactly what separates teams that catch float erosion early from those that discover it at closeout.
Trusted by 750+ customers with a 4.7 G2 rating and a 94% G2 recommendation rate, Rocketlane secured a $60M Series C from Insight Partners in March 2026.
Revenue more than doubled year-over-year, and average deal size grew 4.5x since 2023 for teams that operationalized delivery through Rocketlane. Unlike generic tools that require batch processing to reconcile schedule and resource data, Rocketlane runs on no batch processing: real-time data flows across scheduling, resource management, and financials so float signals reach the right people while there is still time to act.
Services teams using Rocketlane reduce administrative overhead by up to 30%, improve on-time delivery rates, and get real-time float visibility that flows directly into resource decisions and billing workflows without manual data movement between disconnected tools.
What is the future of float in project management?
Float management is shifting from a reactive calculation to a predictive control layer built into the delivery operating model.
Historically, project managers calculated float at planning, checked it at key milestones, and caught float erosion only after the damage was visible. The next generation of delivery operations uses float as a real-time signal that feeds automated alerts, resource optimization, and schedule adjustments without waiting for a human to notice a problem first.
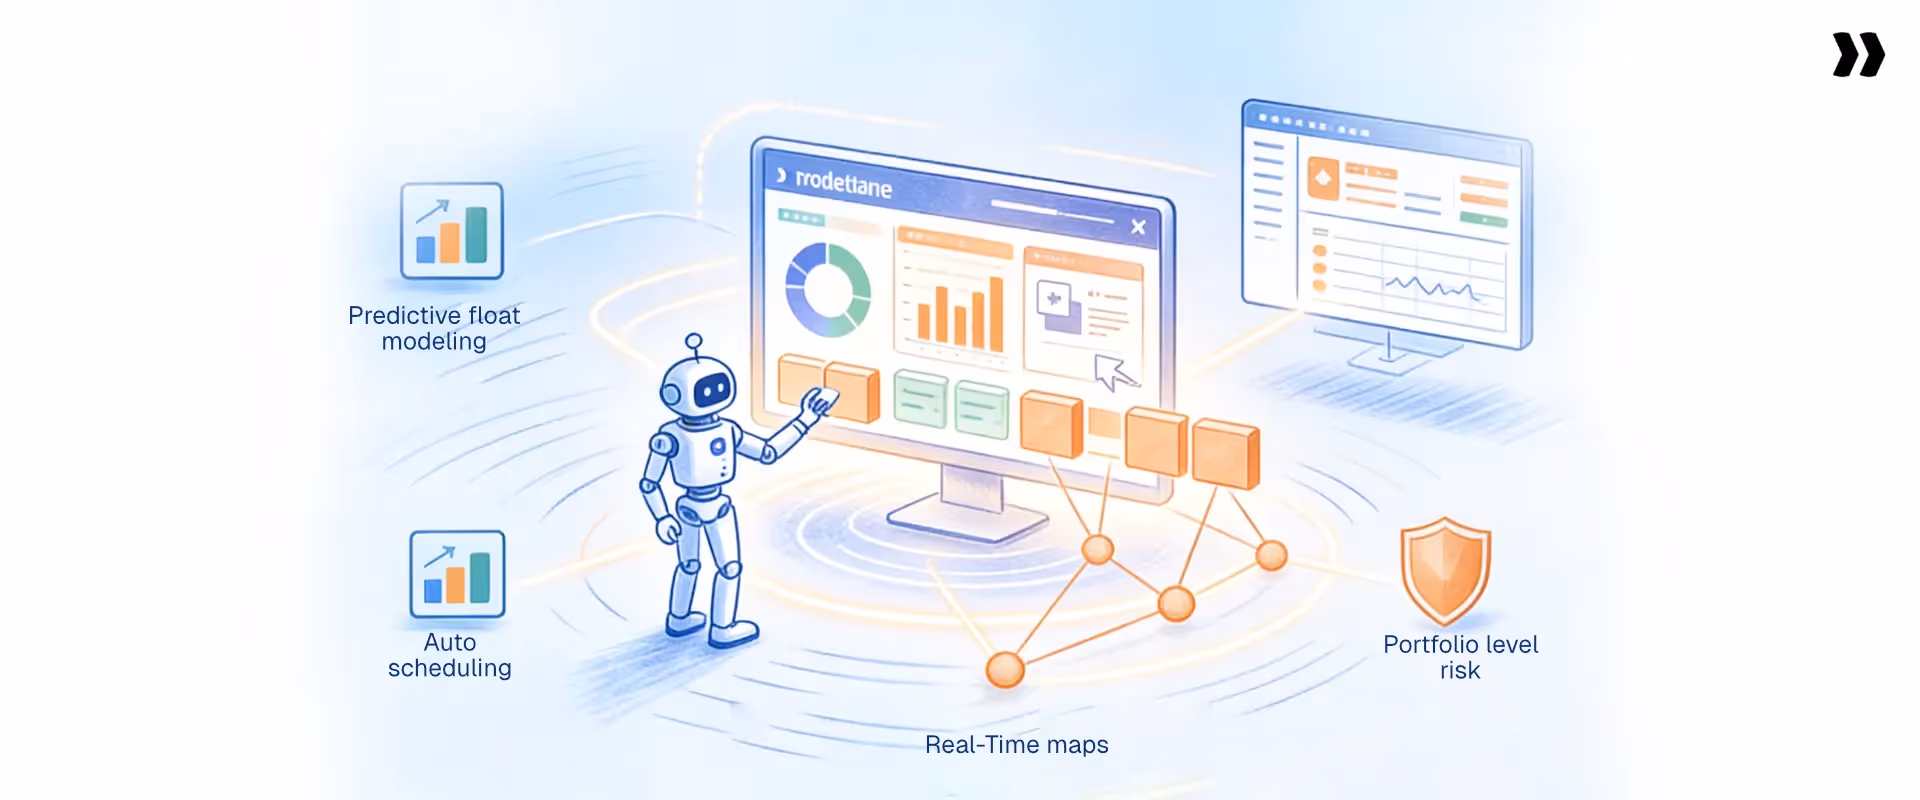
Key trends reshaping how teams manage float
- Predictive float modeling: AI-assisted scheduling tools analyze historical project data to model how fast float erodes in specific project phases and flag consumption patterns that typically precede delays. Instead of watching floats disappear, delivery teams see the trajectory before it hits zero.
- Automated schedule optimization: When float drops below a threshold, automated tools propose schedule adjustments based on current resource availability and dependency logic. A delivery manager reviews and approves the adjustment rather than rebuilding the schedule from scratch.
- AI-driven dependency mapping: Dependency mapping is one of the most error-prone parts of project planning. AI tools identify implicit dependencies based on task patterns and historical project data, producing more accurate float calculations from the start of the project rather than requiring manual correction after errors surface.
- Portfolio-level risk visibility: Float data across concurrent projects feeds portfolio dashboards that surface systemic resourcing and scheduling problems weeks before they appear as individual project failures. For professional services leaders managing 50 or 100 active engagements, this visibility is the only practical way to protect delivery predictability at scale.
Services teams that operationalize float management with integrated tools and real-time data will consistently outperform teams still relying on static schedule analysis and manual float recalculation. The tools exist now. The gap is adoption.
How does Rocketlane Nitro's agentic AI transform float management for PS teams?
Float management fails because it depends on people remembering to act. A PM checks float values on Monday. Tasks shift on Wednesday. By Friday, the critical path has moved, but the schedule still shows Monday's numbers.
Rocketlane Nitro is the agentic execution platform that eliminates this lag. The shift from merely tracking work to actively executing it means float governance runs as a system behavior, not a PM habit. Four agents address the four most common failure modes in float management.
1. Project Governance Agent: Zero-float enforcement on autopilot
Zero-float tasks need daily attention. In practice, they get the same attention as every other task unless someone manually checks the schedule.
The Project Governance Agent continuously monitors the float value of every task. When a task approaches zero float, it fires an alert before the delay occurs. When a critical path task is marked complete without its dependent task unlocked, the agent flags the gap in real time.
Real scenario: a PM marks a data migration phase as complete, but the UAT sign-off dependency remains unresolved. The agent blocks the status update and surfaces the open dependency before the project advances past a stage it cannot safely pass. Float enforcement becomes automatic, even when the PM is managing five other engagements simultaneously.
2. Nitro Analyst: Portfolio-wide float visibility on demand
A delivery director managing 40 concurrent projects cannot review 40 schedules to find which ones have float erosion. The Nitro Analyst instead answers natural-language queries.
"Which active projects have total float below 3 days?"
"Which projects showed the fastest float consumption in the last two weeks?"
"Which critical path tasks are currently unassigned?"
Structured, real-time answers come back without needing to build a report. No batch processing — real-time data drawn from live project execution across the entire portfolio. Leadership sees which projects need intervention before the weekly status meeting, not during it.
3. Signals Agent: Float risk from every client conversation
Float erosion does not always start with a task running late. It often starts with a client email.
A client mentions their IT team is unavailable for two weeks. A stakeholder pushes back on the sign-off timeline. A new requirement surfaces mid-engagement.
These signals predict float risk before the schedule reflects it — and they stay buried in email threads unless something connects them to the project plan.
The Signals Agent monitors customer calls and emails. When a signal indicates a potential delay — a client deprioritizing the project, a dependency timeline shifting, a resource constraint on the client side — it flags the risk and creates a draft RAID entry linked to the affected float.
The project log reflects what is actually happening, not only what was formally reported.
4. Resource Management Agent: Float-weighted allocation at the right time
The standard resource allocation question is: who is available? The right question is: which tasks need the most capacity, based on current float?
The Resource Management Agent identifies when critical-path tasks need additional capacity and surfaces team members assigned to high-float work who can be reallocated without impacting the schedule.
When a zero-float task is running behind, the agent recommends a reallocation that keeps the project on schedule without adding headcount.
Float-weighted allocation improves utilization on work that matters and protects project timelines without eroding margins on fixed-fee engagements.
What to know before you buy: addressing common Rocketlane objections
Teams evaluating Rocketlane for float management and delivery operations often raise four common concerns. Here is how each resolves in practice.
Objection 1: "It is too expensive for our team size." Rocketlane's total cost of ownership, compared to fragmented tools, consistently shows a 5- to 10-point margin lift, translating to $250,000 to $500,000 per year in savings for mid-size PS teams. For most firms, recovered revenue from billing delays and float-driven timeline slippage alone covers the cost.
Objection 2: "Our reporting and visibility needs are too complex." Rocketlane's Nitro Analyst delivers real-time float, utilization, and financial data without manual reporting cycles. Portfolio-level float patterns surface while projects are still in flight, not after they have already slipped.
Objection 3: "The learning curve is too steep." Rocketlane ships with pre-built Playbook templates covering implementation and onboarding workflows. Most teams are running live projects within days of onboarding, and standardized templates reduce setup time across new engagements.
Objection 4: "We only need a project tracker, not a full PSA." Rocketlane is a full PSA platform that covers project scheduling, resource allocation, time tracking, milestone billing, and delivery financials in a single system. Float visibility that connects directly to resource decisions and billing is only possible when those systems share a single data layer.
Conclusion
Float in project management is not a scheduling footnote. It is the control mechanism that determines whether a professional services organization delivers predictably or reacts constantly.
Implementation managers and delivery leads who define float clearly, calculate it accurately, and track it continuously protect margins, reduce escalations, and keep their organizations running without linear headcount growth.
The calculation is not the hard part. Keeping float as a live signal through execution, across 20, 50, or 100 concurrent customer engagements, is where most teams fall short.
And the reason is almost always the same: the tools they use were not built for it. Generic project management tools track tasks. They do not connect float visibility to resource availability, project financials, or customer delivery commitments in the way services organizations need.
The result is float data that exists somewhere but never reaches the people who need to act on it, until the deadline has already passed and the margin has already eroded.
Rocketlane was built for exactly this operating model. It is a PSA platform designed for professional services and implementation teams, where scheduling, resource management, and delivery financials sit in one system.
Float signals surface in real time, resource reallocation reflects schedule priority, and margin impact is visible before timeline slip turns into revenue loss. Services teams using Rocketlane close projects more predictably, escalate less, and scale delivery without the administrative overhead of stitching together disconnected tools.


.webp)