


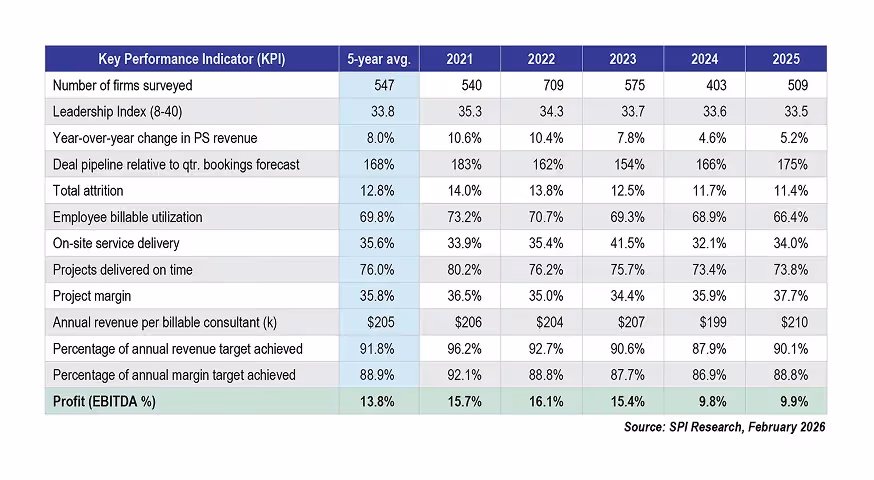
Industry-wide EBITDA in 2025 sits at 9.9%, against a five-year average of 13.8%. That is not a bad quarter.
That is a 28% collapse relative to what professional services have historically delivered, and it happened quickly.
EBITDA held above 15% for three straight years through 2023, then fell off a cliff to 9.8% in 2024. It barely moved in 2025. The industry has not been drifting downward. It stepped off a ledge.
Most PS leaders measure themselves against last year's numbers, a competitor's offhand comment, or gut feel from a strong Q3.
The 2026 Professional Services Maturity Benchmark holds a different kind of mirror: one built from 160+ KPIs across 509 real organizations managing $63 billion in PS revenue.
This year's data tells a contradictory story.
Project margins hit a five-year high. Revenue leakage hit a five-year low. Revenue growth recovered from 4.6% to 5.2%.
And yet, billable utilization just fell to an all-time historic low.
Client NPS cratered 12% in a single year. Only 17.2% of firms hit 100% of their annual margin target.
The gap between high-performance PS organizations and the rest is not widening gradually. It is compounding.
Here is what the data shows, what it means for your team, and what top performers are doing differently.
This benchmark was co-published by Rocketlane and SPI Research.
Download the full benchmark report here -> Download link
What Is the Professional Services Maturity Benchmark?
Who publishes it, and what does it measure?
Rocketlane partnered with Service Performance Insight (SPI Research) to release the 2026 Professional Services Maturity Benchmark, the 19th annual edition of the industry's most comprehensive PS performance study.
This year's report is based on a survey of 509 professional services organizations representing 245,000+ employees and $63 billion in PS revenue.
It tracks 160+ key performance indicators across five Service Performance Pillars and five maturity levels.
Over 50,000 service and project-oriented organizations worldwide use the PS Maturity Model as a strategic planning and performance framework.
What are the five Service Performance Pillars?
The PS Maturity Model is built on five functional pillars, each one representing a core area of PS organizational health:
- Leadership: vision, strategy, communication, data-driven decision making
- Client Relationships: pipeline, bids won, NPS, pricing structure, CX programs
- Talent: utilization, attrition, hiring, compensation, career paths
- Service Execution: on-time delivery, project margins, PMO use, methodology
- Finance and Operations: EBITDA, revenue leakage, DSO, forecasting accuracy
All five connect through the Plan-to-Profit (P2P) process.
Maturity in one pillar does not compensate for weakness in another.
The firms that pull away from the pack move all five together.
What do the five maturity levels mean in plain English?
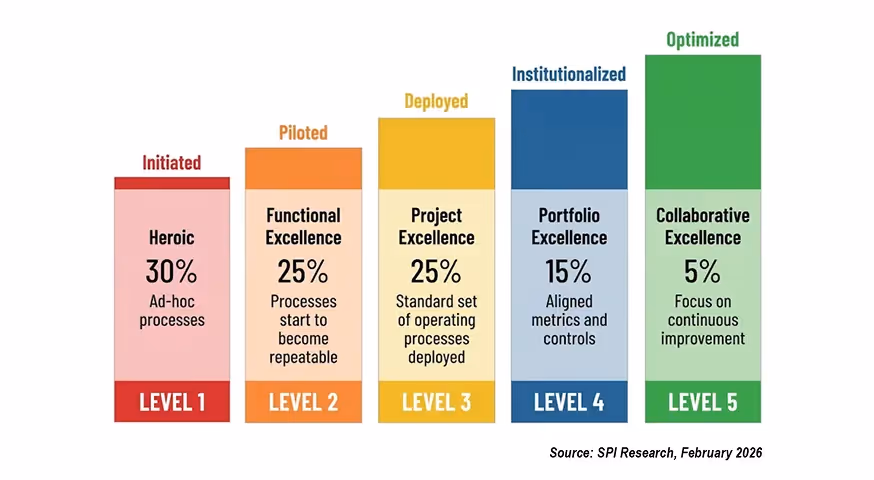
The model runs from Level 1 to Level 5, from survival mode to full optimization:
- Level 1 (Initiated): focused on winning clients and surviving; most firms here lose money
- Level 2 (Piloted): becoming a profit center; fixing the biggest operational gaps
- Level 3 (Deployed): core processes working across all 5 pillars; EBITDA turns positive
- Level 4 (Institutionalized): optimizing and scaling; margin becomes the obsession
- Level 5 (Optimized): 27% EBITDA; 89.6% on-time delivery
The 2025 industry average maturity across all 509 firms: 2.40 out of 5.
Most of the professional services market is still operating in early-to-mid deployment.
The State of Professional Services in 2025
Where is the industry recovering?
The 2025 data reflects a sector navigating cautious improvement.
Revenue growth recovered to 5.2% in 2024 from 4.6% in 2023, a meaningful rebound, though still far below SPI's 8% long-run benchmark.
Revenue per employee climbed 6% to $168k, signaling rising efficiency even as headcount growth slowed to 2.8%.
Project margins hit a five-year high at 37.7% overall. T&M-specific margins reached 36.4%, and fixed-price reached 37.2%.
Revenue leakage improved to a five-year low of 4.5%.
And 90.1% of firms hit their revenue targets, up from 87.9% the year before.
The recovery story is real. But it is uneven, and three critical metrics are flashing warnings.
Where is the industry under pressure?
1. Utilization hit an all-time historic low.
Billable utilization fell to 66.4% in 2025, surpassing the previous record low set in 2024. It now sits 3.6 points below the 70% threshold SPI considers the minimum healthy benchmark. ESO utilization fell even harder: from 69.0% to 64.9%. The survey calls this plainly: Employee billable utilization is at its lowest level ever.
2. EBITDA is 28% below its five-year average.
The 2025 industry-wide EBITDA of 9.9% compares to a five-year average of 13.8%. This is not a slow drift. It is a cliff. EBITDA held at 15-16% from 2021 through 2023, then crashed to 9.8% in a single year and has barely recovered. The report attributes this compression to rising non-billable costs, falling utilization, and pricing pressure from clients demanding more flexible models.
3. Client satisfaction is in freefall.
NPS dropped from 63.5 in 2024 to 56.0 in 2025, a 12% decline confirmed across all organization size segments. NPS below 60 is a risk zone for client retention. The industry average just crossed into it.
What's the profit chasm between maturity levels?
Against a five-year average EBITDA of 13.8%, most PS firms operating at Levels 1-2 are not in a growth story.
They are in a survival story. The question is not whether maturity matters. It is how fast you move.
What Do High-Performance PS Organizations Do Differently?
Who qualifies as an HPO in 2026?
High-performance PSOs (HPOs) represent the top 20% of surveyed firms, 101 organizations out of 509. They are concentrated at Levels 4 and 5 of the PS Maturity Model.
Three out of four are independent PSOs; the rest are embedded service organizations. IT consultancies (31%) and management consultancies (24%) make up the bulk.
What is striking is their size: HPOs average 408 employees, smaller than the broader survey average of 500, yet they generate significantly more revenue, win larger deals, and deliver at a higher margin. Size is not the differentiator. Discipline is.
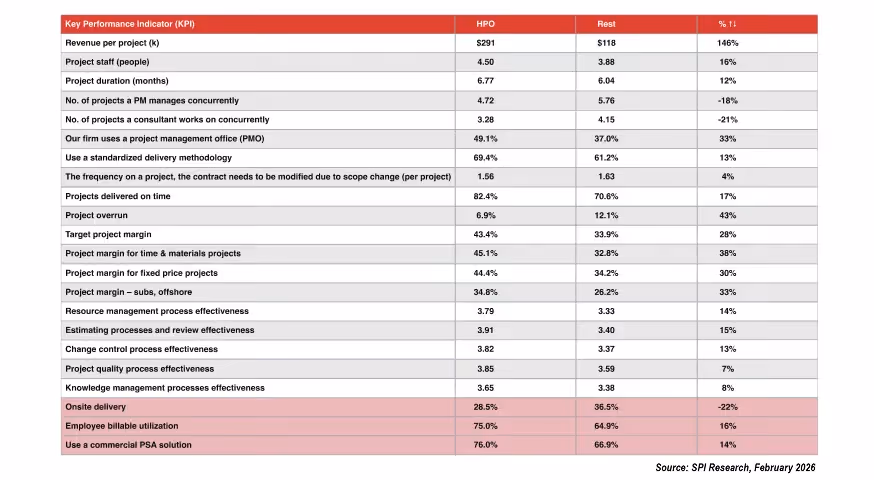
How wide is the HPO performance gap?
The data speaks for itself.
HPOs are not winning on a single metric. They are winning across all of them simultaneously, which is exactly what the maturity model predicts when all five pillars move together.
How do HPOs lead and communicate differently?
HPOs share company strategy every 10.9 months, not annually, on a deliberate cadence.
The rest share it every 16.9 months. HPOs share operational metrics with staff every 4.79 months, nearly twice as often as the rest, which share them every 9.32 months.
HPOs score 11% higher on being data-driven (3.86 vs. 3.47). Their ease of getting things done score is the single largest differentiator from the rest.
SPI Research put it plainly: A primary concern for organizations will be sustaining profitability, which will require executives to manage expenditures carefully and focus on increasing margins. HPOs do not react to this. They are already measuring for it.
How do HPOs win more clients and hold their pricing?
HPOs discount 37% less than the rest: 6.0% vs. 9.6%. They win 56.5% of bids vs. 45.1% for the rest. Their pipeline coverage is 224% of quarterly bookings, up from 158%. And 79% of their clients are referenceable vs. 64.3%.
None of this happens by accident. Firms with a formal customer experience (CX) program grow 57% faster than those without: 6.6% vs. 4.2% revenue growth.
HPOs score 23% higher on CX program maturity. Referenceable clients and repeatable win rates are not marketing outcomes. They are delivery outcomes.
Why Your Margins Are Stuck (And How PSA Fixes It)
.avif)
Why do most PS firms plateau between 33-38% project margin?
The industry T&M project margin in 2025 hit 36.4%, the highest in five years. But HPOs are running at 45.1% T&M margin. The gap is 8.7 percentage points and structural.
Level 2 firms average 22.6% project margin. That is the wall most growing PS teams hit before they build the processes to cross into Level 3.
The culprits are not external. They are operational: poor estimating, reactive scope management, overloaded project managers, and no real-time margin visibility until it is too late to course-correct.
SPI's benchmark is clear: sustaining a project margin above 35% signals effective pricing and delivery management.
Most firms are either just clearing it or still short.
What does PSA satisfaction actually do to your margins?
The gap between Very Dissatisfied and Satisfied PSA users is approximately 3.7 margin points and $22,000 in annual revenue per consultant, driven purely by how well the tool is adopted and used.
Note: the relationship between PSA satisfaction and outcomes is not linear.
Neutral users show the highest revenue per consultant ($215k), suggesting a nuanced interplay among tool fit, adoption depth, and actual outcomes.
PSA users average 8% higher billable utilization than non-users (66.4% vs. 63.5%). HPOs integrate PSA with their core financial management system at 64.6% vs. 53.1% for the rest.
That integration is where real-time project margin visibility is built and where overruns are caught before they become write-offs.
The SaaS PS paradox: highest adoption, steepest satisfaction decline
SaaS PS teams have the highest PSA adoption of any segment: 90.2%. Yet they saw the steepest decline in PSA satisfaction of any market segment: a 12% drop to 3.29 out of 5 in 2025.
The industry average fell 3%. SaaS PS fell four times faster.
SaaS PS teams did not stop using PSA. They kept using tools that were not built for how they deliver.
The volume of adoption without satisfaction tells you exactly what the market gap looks like: clear demand for tools built specifically for how modern SaaS PS teams work.
The five levers that directly move the project margin
HPOs do not rely on rate increases or headcount cuts to protect margin. They build process discipline across five areas:
- Estimating accuracy: HPO 3.91 vs. 3.40 for rest (+15%)
- Change control discipline: HPO 3.82 vs. 3.37 (+13%)
- Resource management effectiveness: HPO 3.79 vs. 3.33 (+14%)
- Standardized methodology use: HPOs use it 13% more consistently (69.4% vs. 61.2%)
- PSA-CFM integration: delivers real-time margin visibility at the project level before losses compound
The Utilization Death Spiral: How to Recover
Why is billable utilization falling, and why should you be concerned?
Billable utilization in 2025 fell to 66.4%, an all-time historic low, surpassing the previous record low set just one year earlier. That phrase comes directly from the report. It is not hedged or softened.
At 66.4%, the industry now sits 3.6 points below the 70% threshold SPI considers the minimum healthy benchmark, and 8.6 points below the 75% level that HPOs consistently maintain.
ESO utilization dropped harder: from 69.0% to 64.9%.
The spiral is self-reinforcing. Low utilization raises the cost per billable hour. That compresses the margin. Margin pressure triggers rate discounting to win bids.
Discounting lowers revenue per consultant. Lower revenue means less budget for tools, training, and onboarding. And the utilization number drops again.
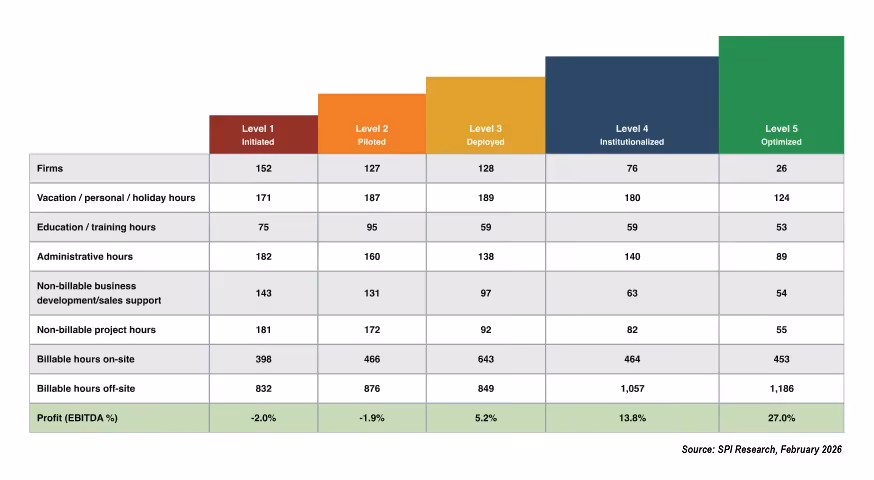
What does the HPO utilization gap look like in real hours and revenue?
At the industry-average day rate of $1,035, 137 additional billable hours translate to approximately $17,800 in additional revenue per consultant annually.
Across a 50-person delivery team, that is roughly $890,000 in annual revenue.
Not from a new hire, not from a rate increase. Just from recovering lost hours.
What actually moves the utilization needle?
- Fewer concurrent projects per consultant: HPOs average 3.28 projects vs. 4.15 for the rest (21% fewer). Focus compounds into logged hours.
- Faster onboarding: HPOs reach productivity in 54 days vs. 65.5 days. Every week recovered is a week of billable capacity.
- PMO adoption: HPOs use PMOs at 49.1% vs. 37.0% for the rest.
- PSA for real-time capacity visibility: HPOs use commercial PSA at 76% vs. 66.9%; PSA users average 8% higher utilization.
- Remote-first delivery: HPOs deliver 71.5% of work remotely and outperform on every talent metric.
The Level 5 proof point: utilization reaches 81.2% at full maturity.
The ceiling is achievable. The question is what is blocking you from moving toward it.
AI ROI for Service Delivery Teams
How fast is AI adoption growing in professional services?
27.1% of PS projects now incorporate Generative AI, up from 19.3% in 2024. That is a 40% year-over-year jump.
At the same time, 40% of PS firms now actively sell AI-related services, and SPI projects AI will account for 22-37% of future PS revenue.
The estimated 12-month ROI from GenAI implementation is 13.3%, up from 10.0% the year before, a 33% improvement. The market is past the experimentation stage.
It is entering the operationalization stage.
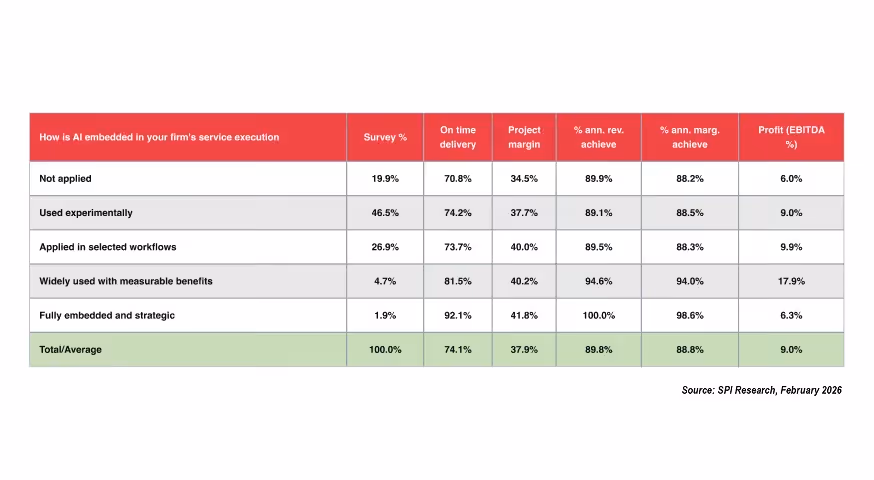
What does the data show AI does to your delivery outcomes?
*This cohort represents only 1.9% of surveyed firms and is too small for statistically conclusive findings.
The EBITDA figure does not align with the adoption trend observed across all other stages and should be treated as directional only.
The performance trajectory from experimental to widely used with measurable benefits is the statistically meaningful story here.
Moving from experimental to widely used with measurable benefits: on-time delivery jumps from 74.2% to 81.5%, and EBITDA nearly doubles from 9.0% to 17.9%. The ROI does not come from trying AI. It comes from operationalizing it.
The Finance and Operations picture (Table 74) reinforces this: firms that widely apply AI in F&O with measurable benefits achieve 24.2% EBITDA vs. 8.8% for non-users. Revenue per consultant rises to $225k vs. $203k.
Will AI replace PS professionals?
SPI Research's position is direct: AI will transform Professional Services, but it will not render them obsolete.
The future human PS role is in contextual interpretation, risk navigation, alignment-building, and accepting accountability for outcomes.
Clients will continue to rely on trusted professionals to oversee transformation and manage risk.
That relationship-based accountability is not automatable.
The real competitive risk is not AI replacing consultants.
It is competitors who operationalize AI faster, outperforming you on margin, delivery, and client experience, while your team is still running manual resource plans in spreadsheets.
What Moving Up the Maturity Curve Does to Your Numbers
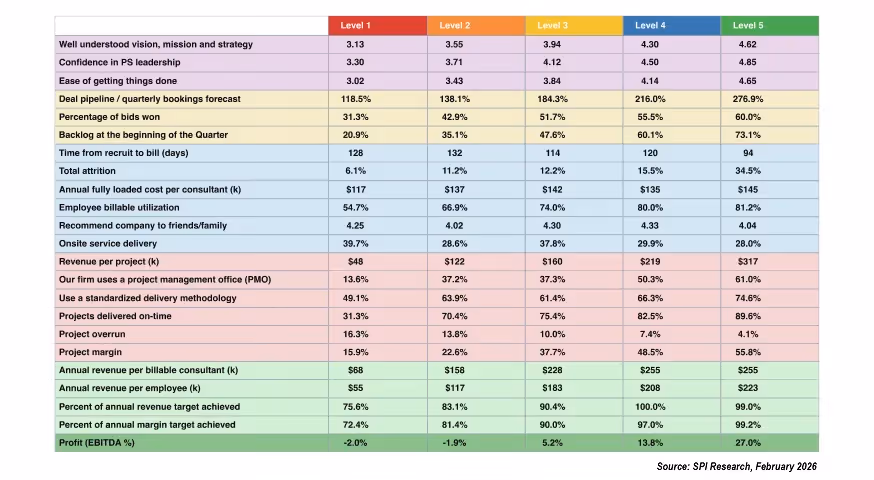
What is the financial payoff at each maturity level?
Four inflection points define the journey:
- L1 to L2: On-time delivery nearly doubles from 31.3% to 70.4%. Bid win rate jumps 12 points. Revenue per project more than doubles.
- L2 to L3: The profitability crossing. EBITDA turns positive at 5.2%. Project margin jumps from 22.6% to 37.7%. Revenue per consultant rises from $158k to $228k.
- L3 to L4: EBITDA more than doubles to 13.8%. Project margin breaks 48%. On-time delivery crosses 82%.
- L4 to L5: EBITDA reaches 27.0%. Project margin hits 55.8%. Utilization reaches 81.2%. Revenue per project: $317k.
What are the five metrics that predict PS success?
The industry is hovering right at the threshold on nearly every metric. High performance is not about breaking records.
It is about consistently clearing the bar across all five, all year. SPI Research puts it simply: Running a service organization is a game of singles and doubles.
Small percentage improvements in just a few key performance areas can produce dramatic bottom-line results.
Recommendations for PS Leaders in 2026
Leadership: communicate more, not more loudly
HPOs do not reserve strategy for annual all-hands. They share it every 10.9 months on a deliberate cadence. They share financial and operational metrics with their teams every 4.79 months, nearly twice as often as the rest. Build a data-first culture.
HPOs score 11% higher on data-driven decision making (3.86 vs. 3.47).
Client Relationships: NPS at 56.0 is a warning, not a data point
NPS fell 12% in a single year. Every size segment declined: firms under 10 employees fell 14%, and IT Consulting fell 14%.
The industry average of 56.0 now sits inside the risk zone for client retention.
Build a formal CX program. Firms with one grow 57% faster than those without.
Move toward T&M pricing, now at 43.5% of contracts and rising, for better margin visibility.
And focus on existing clients: HPOs earn 64% of revenue from current accounts, not new logos.
Talent: remote-first is a margin strategy, not a perk
HPOs deliver 71.5% of work remotely and outperform on every talent metric. More remote does not mean less billable.
The HPO hours data prove the opposite.
Keep concurrent project loads low. HPOs average 3.28 projects per consultant vs. 4.15 for the rest.
Fewer projects mean deeper focus, fewer context-switch costs, and more hours logged per engagement.
Reduce onboarding time. Every week saved from the 65.5-day average is a week of billable capacity recovered.
Service Execution: standardize before you scale
PMO adoption jumped from 34.6% to 40.3% industry-wide in 2025, a 16% increase in a single year.
HPOs use PMOs at 49.1% vs. 37.0% for the rest.
Standardize your methodology: 63.4% of firms have one, but HPOs use standardized delivery 13% more consistently.
Keep project overrun below 10%.
Above that threshold, the benchmark data shows client relationships begin to deteriorate systematically.
HPOs average 6.9% overrun vs. 12.1% for the rest.
Finance and Operations: track five things, relentlessly
The SPI benchmarks are specific: utilization above 70%, overrun below 10%, project margin above 35%, revenue per billable consultant above $200k, revenue leakage below 5%.
Executive real-time visibility is declining: 3.53 in 2025, down from 3.65 in 2024. HPOs are 19% more visible across their organizations (3.99 vs. 3.35). G&A as a percentage of revenue improved from 10.4% to 8.0%, proof that cost discipline is achievable without cutting capability.
How Rocketlane Helps PS Teams Reach the Next Level with AI
Most PS teams stall at Level 2 or 3 for one reason: they lack integrated real-time visibility across delivery, resources, and financials.
That is the single capability the 2026 benchmark proves separates high-performance organizations from the rest. HPOs have it.
The rest are still stitching together signals from disconnected tools.
Among the 509 global organizations in the 2026 SPI benchmark, 30 chose Rocketlane, making it one of the most widely adopted PSA solutions in the market.
That is in a market dominated by tools that have been around for 15 to 20 years, built for a delivery model that predates SaaS PS as a category.
90.2% of SaaS PS teams use PSA, but SaaS PS saw the steepest decline in PSA satisfaction of any segment, dropping 12% to 3.29 out of 5.
They did not stop using PSA. They kept using tools that were not built for how modern service teams deliver.
Rocketlane is built to move the five metrics that the 2026 benchmark proves matter most: utilization, project overrun, project margin, revenue leakage, and revenue per consultant.
It connects delivery to your CRM and financial systems, closing the integration gap where most margin visibility is lost.
It gives every project manager, resource manager, and finance lead the same real-time picture of what is happening across the book of work.
The firms in this year's benchmark that hit 75%+ utilization, 45%+ margins, and 82%+ on-time delivery did not get there by hiring more people or raising rates.
They got there by building systems where nothing falls through the cracks.
You are one step away from delivery that actually hits the benchmark.
- Hit 75%+ billable utilization, the HPO standard across 101 top-performing firms
- Cut project overrun below 10%, the threshold where client relationships stay intact
- Build real-time margin visibility across every engagement before losses compound.
Start your 14-day free trial, no credit card required.
Want to turn your enterprise PS organization into a high performance organization?
Book a demo with our PSA expert now!
Source:
2026 Professional Services Maturity Benchmark by SPI Research, sponsored by Rocketlane.
Published February 2026.
Based on a survey of 509 professional services organizations representing 245,000+ employees and $63 billion in PS revenue.


.webp)