Project Performance: The Complete Guide for Professional Services Teams (2026)


•
•
Summarize blog with






Every professional services leader has had the same unsettling realization at least once. The dashboard said green. The quarter said otherwise.
It is tempting to read that as a people problem: a PM who missed something, a consultant who overpromised. It almost never is.
The dashboard was green because the data behind it was a week old, assembled by hand from five different systems, each telling a partial truth. Schedule lived in one tool, margin in another, client sentiment in nobody's tool at all. By the time the full picture came together, the project had already moved.
That is the quiet trap of project performance in professional services. It is not one number you can watch. It is five dimensions moving at once, and most teams can only see them one at a time, after the fact. The teams that protect margin are not working harder or hiring better PMs.
They have closed the gap between work in progress and performance becoming visible, from weeks to hours.
Before we get to how they do that, it helps to be precise about what project performance means in professional services, and why it differs from the generic version.
What is project performance?
Project performance is the continuous measurement of how a project executes against its planned schedule, budget, resource allocation, delivery quality, and customer experience- five dimensions tracked simultaneously, not sequentially.
The problem: most professional services teams track these dimensions in different systems and at different cadences, so by the time the picture is assembled, projects have already gone red.
High-performing PS teams shorten the gap between work in progress and performance visibility to hours, not weeks, by eliminating batch processing and ensuring real-time data flows through a single system.
Rocketlane is the agentic execution platform PS teams use to make the shift from merely tracking work to actively executing it. It is trusted by 750+ customers, has a 94% G2 recommendation rate, has raised a $60M Series C from Insight Partners (March 2026), and has seen revenue more than double year-over-year.
This guide defines project performance, the five dimensions that matter, the leading indicators that predict slippage 2–3 weeks ahead, and how to run performance management as continuous governance rather than monthly reporting.
What is project performance in project management?
Project performance in project management is the measurement of how effectively a project is progressing against its planned scope, schedule, budget, and quality objectives. For professional services teams, project performance encompasses an additional dimension that generic frameworks miss: the client experience throughout the delivery process.
Managing project scope is essential to prevent scope creep and ensure that project objectives remain clear and achievable. Project managers play a critical role in guiding team members, coordinating resources, and maintaining alignment with project goals to achieve stakeholder satisfaction.
A project that finishes on time and on budget but leaves the client feeling unsupported and uninformed has underperformed, regardless of what the metrics show.
Project performance is not a single number. It is a composite of five dimensions running simultaneously. Project success is determined not only by meeting schedule and budget, but also by delivering a successful project that aligns with stakeholder expectations and the defined project scope.
The challenge: most professional services organizations track these dimensions in different systems, at different cadences, by different people. By the time someone assembles the complete picture, the project has already moved.
High-performing professional services organizations do not stop at measurement. They manage performance predictively. The distinction is between knowing what happened (measurement) and intervening before it happens (management).
What is project performance management?
Project performance management is the structured discipline of setting performance baselines, continuously monitoring progress against those baselines, identifying deviations early, and taking corrective action before deviations become overruns. In professional services, it integrates financial performance, resource efficiency, delivery health, and client satisfaction as connected dimensions.
The performance management and project management processes are integrated to ensure continuous improvement across all project phases, align project objectives with organizational goals, and enhance efficiency. These dimensions move together.
Treating them as separate reporting streams is the most common operational failure in PS delivery. Regular performance reviews during project execution enable timely adjustments and improve project outcomes.
Project performance vs. project management: What's the difference?
- Project management is the execution function: planning, coordinating, and delivering the work.
- Project performance management is the governance function: measuring, monitoring, and intervening to protect outcomes.
- Portfolio management and strategic alignment are essential for ensuring that project performance management supports broader organizational objectives by integrating project, program, and portfolio management to optimize results and ensure projects are aligned with organizational goals.
- The two must be connected in real time. Performance data that arrives after delivery decisions are made is history, not governance.
What are the five dimensions of project performance in professional services?
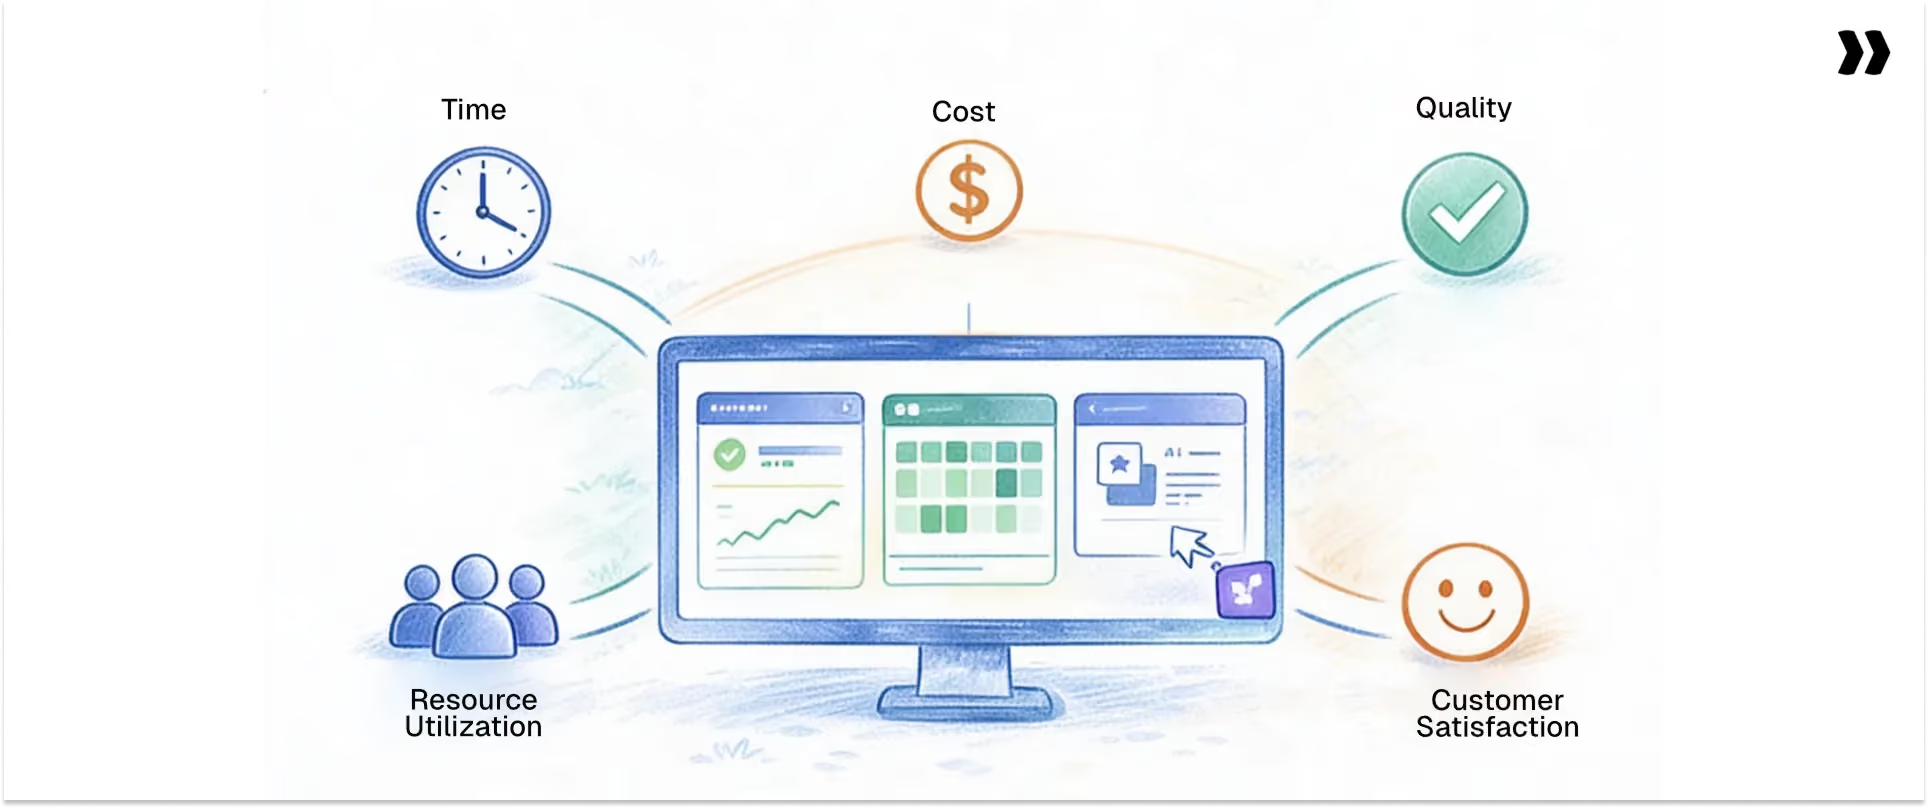
Generic project management frameworks measure three dimensions: scope, schedule, and cost. Professional services delivery requires five. The two that most frameworks miss are the ones that most directly drive client retention and margin protection.
In project-based organizations, which often manage many projects simultaneously, effective project teams and robust project evaluation processes are essential to ensure consistent results and organizational success.
Schedule performance
Schedule performance measures whether projects progress against planned project timelines, tracking milestone completion, phase duration, and task overdue rates. Managing project timelines is crucial to prevent delays, control scope creep, and ensure timely project delivery.
Continuous monitoring is essential to maintain steady progress, allowing for timely adjustments and consistent advancement throughout the project lifecycle. In professional services, external dependencies complicate it: client approvals, data readiness, stakeholder availability.
Key metrics: Schedule Performance Index (SPI), on-time milestone rate, phase duration variance.
Leading indicator: Rising overdue task count predicts milestone slip 2 to 3 weeks ahead.
Financial performance
Financial performance measures whether projects deliver the margin they were sold for: budget consumption against scope, cost variance, burn rate, and projected margin at completion. Effective management of project costs is essential to avoid cost overruns and budget overruns, as these issues can negatively impact project performance and profitability. On fixed-fee projects, every unplanned hour comes directly from margin.
Key metrics: Cost Performance Index (CPI), budget variance, Estimate at Completion (EAC), non-billable time percentage.
Leading indicator: Burn rate running ahead of scope completion surfaces margin erosion before it appears in the P&L.
Resource performance
Resource performance measures how effectively teams deploy capacity: billable utilization, allocation accuracy, bench time, and skill-to-project alignment. Resource quality is a key factor in ensuring optimal resource performance and project outcomes. Underutilization is a revenue leak. Overallocation is a burnout and quality risk.
Key metrics: Billable utilization (target 65% to 75%), planned vs. actual allocation variance, bench time rate.
PS-specific note: Fractionalized resources (consultants spread across 10 to 15 projects) are a performance problem invisible in aggregate utilization numbers.
Delivery quality
Delivery quality measures whether work meets agreed standards: defect rates, rework volume, scope adherence, and governance checkpoint completion. In professional services, quality failures compound. A missed User Acceptance Testing (UAT) sign-off in week 8 causes a go-live delay in week 12.
Key metrics: Rework rate, governance checkpoint completion rate, phase acceptance rate, defect density (number of defects or bugs identified per unit of work).
Leading indicator: Governance bypasses (phases advancing without required sign-offs) are the strongest predictor of late-stage quality failures.
Customer satisfaction performance
Customer satisfaction performance measures client experience across the delivery lifecycle, not only at project close. Engaging key stakeholders throughout the delivery lifecycle is essential to ensure their needs and expectations are met, directly impacting customer satisfaction. Customer Satisfaction Score (CSAT) at milestones, portal engagement, and response time predict retention and expansion forming during implementation.
Key metrics: CSAT at kickoff, mid-project, and go-live; customer task completion rate; client response time.
PS-specific note: Uninformed clients signal dissatisfaction through disengagement and late approvals weeks before NPS catches it.
How do you measure project performance the right way?
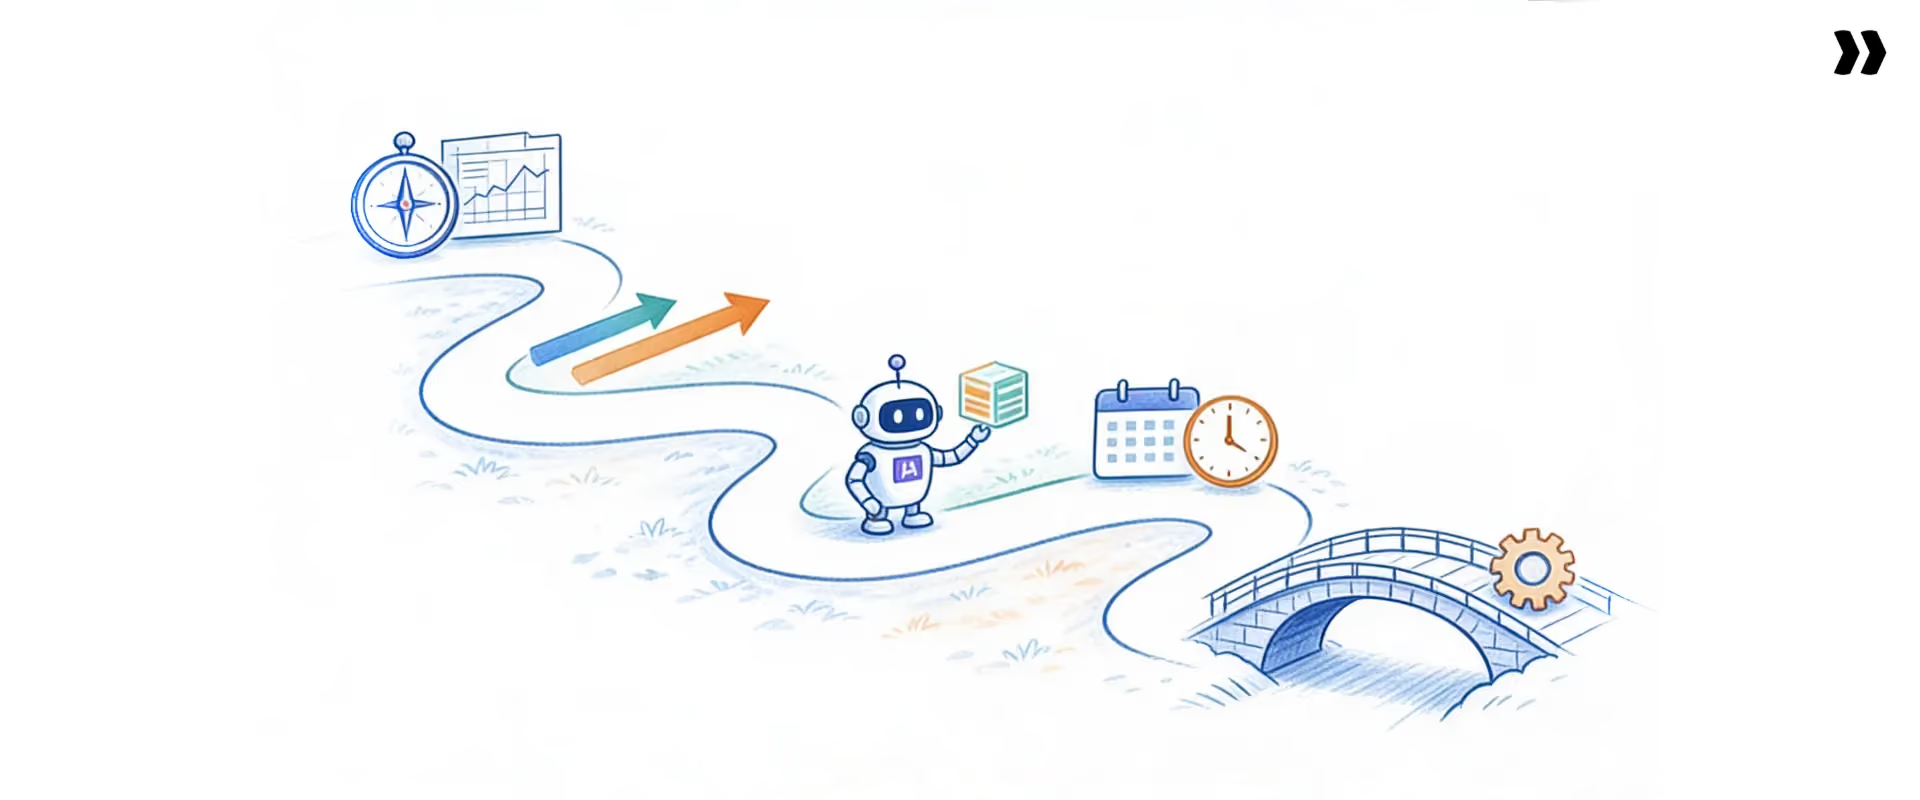
Measuring project performance is not about collecting every data point available. It is about collecting the data points that enable decisions you could not make otherwise.
Step 1: Establish baselines before projects begin
At project kickoff, clearly define the project's purpose and project goals to ensure alignment and provide a foundation for effective measurement. Document the planned schedule, budget, resource allocation, and quality criteria in a detailed project plan. Comprehensive documentation at this stage is essential for tracking progress, clarifying responsibilities, and preventing misunderstandings.
This baseline, often captured in the Statement of Work (SOW), serves as the reference point for all performance measurement. Using project templates to standardize and document processes helps ensure consistency and efficiency across projects. A vague SOW produces vague measurement.
Step 2: Define leading and lagging indicators for each dimension
Leading indicators predict performance 2 to 3 weeks ahead. Examples: overdue tasks this week, burn rate relative to scope completion, client approval response time. Lagging indicators confirm what already happened: final margin, on-time delivery rate, project close CSAT. Rule of thumb: every lagging metric needs at least one leading indicator that predicts it.
Step 3: Automate data collection by removing human-reported inputs wherever possible
Time tracking should update in real time and be connected to project tasks. Milestone completion should be triggered by system events, not PM updates. Budget consumption should calculate from live time and cost rate data. Human-reported performance data is optimistically biased. Systems enforce accuracy where humans apply judgment.
Step 4: Set review cadences that match the urgency of the metric
Match review cadence to the urgency of each metric. Daily metrics require intervention within the day. Quarterly metrics inform strategy, not active delivery.
- Daily: Overdue tasks, active escalations
- Weekly: Burn rate, schedule variance, resource utilization, at-risk project count
- Monthly: Portfolio margin, utilization trends, CSAT aggregation
- Quarterly: Template accuracy, estimation improvement, portfolio benchmarks
The wrong cadence creates problems either way: daily review of monthly metrics generates noise; quarterly review of daily metrics generates fires.
Step 5: Connect metrics to corrective actions, not only reports
A metric without a defined corrective action is a data point, not governance. For each key metric, define the threshold that triggers review, the owner, and the default response. Performance data that does not drive action is reporting overhead.
A comprehensive framework that incorporates these elements supports effective risk mitigation and robust project performance measurement.
Which project performance metrics matter most for PS teams?

Not all project performance metrics deserve equal attention. These project performance KPIs and indicators correlate most directly with margin protection, delivery predictability, and client retention. They build on standard project management metrics with PS-specific weighting. Value management, including earned value management techniques, helps integrate schedule, cost, and progress data to provide a holistic view of project performance.
By tracking performance trends through KPIs, teams can identify deviations early, manage risks, and improve project outcomes.
Schedule performance metrics
Schedule metrics measure delivery predictability against planned timelines. They surface slip 2 to 3 weeks before it appears in escalations.
On-time milestone rate: (Milestones completed on schedule ÷ total milestones) × 100. Target: above 80%. Below 70% signals systemic estimation or dependency problems.
Schedule performance index (SPI): EV (Earned Value) ÷ PV (Planned Value). SPI below 0.85 on a fixed-fee project is an immediate intervention trigger.
Effort variance: (Actual hours − Planned hours) ÷ Planned hours × 100. Consistent positive variance signals a pricing or estimation problem.
Financial performance metrics
Financial metrics measure whether projects deliver the margin they were sold for. They flag erosion before it appears in the P&L.
Project margin at completion: (Revenue − Total delivery cost) ÷ Revenue × 100. Track weekly on fixed-fee projects. Projected margin below 15% requires immediate action.
Budget consumption vs. scope completion gap: Budget consumed % minus scope delivered %. A gap above 10 percentage points signals project burn rate outrunning scope completion.
Billable utilization rate: (Billable hours ÷ total available hours) × 100. Target: 65% to 75%. Below 60% leaks revenue; above 80% consistently risks burnout and quality.
Resource performance metrics
Resource metrics measure how productively teams deploy capacity. They reveal wasted capacity, overallocation, and skill mismatches.
Planned vs. actual allocation variance: (Planned hours − actual hours) ÷ planned hours × 100. Consistent variance reveals estimation patterns to fix in templates.
Bench time rate: (Unallocated hours ÷ total available hours) × 100. Target: below 15%. Above 20% signals a pipeline or staffing mix problem.
Delivery quality metrics
Quality metrics surface whether work is being done right the first time. They predict late-stage delivery failures before clients raise them.
Governance checkpoint completion rate: % of required phase-gate sign-offs completed before advancement. Projects bypassing checkpoints are statistically more likely to produce late-stage delivery failures.
Rework rate: Hours spent on rework ÷ total project hours. Consistent rework above 10% indicates a problem with scope or requirements capture.
Customer performance metrics
Customer metrics track the dimension generic frameworks miss: client experience across delivery. They predict retention and expansion before NPS catches them.
CSAT at key milestones: Measure at kickoff, mid-project, and go-live, not only at close. CSAT trending downward mid-project signals a relationship at risk.
Time to value (TTV): Actual days from contract signature to first realized value event. Improvement against your historical baseline signals delivery maturity.
Client task completion rate: % of client-owned tasks completed on schedule. Below 70% predicts external dependency delays that will impact go-live.
How do you track project performance in real time?
Most professional services organizations can measure performance at a point in time. Few can track it continuously. The difference is whether measurement connects to live delivery data or depends on manual inputs.
Utilizing software tools and project management tools enables real-time tracking, streamlining tasks and enhancing transparency across teams. Incorporating feedback loops is crucial for continuous monitoring, regular updates, and timely adjustments, ensuring that problems are identified and addressed before corrective windows have closed.
What real-time project performance tracking requires
Real-time project performance tracking requires four capabilities:
- Time tracking updates financial and utilization metrics as hours are logged, not at timesheet approval.
- Milestone completion triggers automatically when defined criteria are met, not when a PM updates a status field.
- Project health scoring calculates from actual data (schedule, budget, CSAT), not from self-reporting.
- A portfolio view aggregates all active project performance in one screen without manual compilation.
Each capability removes a layer of latency between work happening and the performance data that reflects it. Together, they close the gap between delivery and visibility.
The tracking cadence that works for PS
Different metrics demand different review cadences:
The cadence design follows from the metric's volatility. Daily-changing data needs daily review. Quarterly-shifting data does not.
The tracking anti-pattern to avoid
The most common tracking failure: keeping performance data in a separate tool from where delivery happens. When the performance dashboard and the project execution system are different tools, someone bridges them manually. The dashboard is always behind reality. Real-time project performance visibility requires that delivery, financial, and resource data live in a single system.
How do you assess what’s driving project underperformance?
When project performance is poor, the instinct is to work harder. The right response is project performance assessment: a systematic analysis of what is driving underperformance. Reviewing past projects is essential for identifying trends and helping project managers learn from previous experiences, ensuring continuous improvement and avoiding repeated mistakes. The same root cause usually drives underperformance across multiple projects. Working harder on the wrong thing does not fix it.
The five root causes of project performance failure in PS
MIT Sloan Management Review research shows that the most common cause of project overruns is not individual execution failure but the absence of leading indicators that surface problems before they compound, which is why the five root causes below are infrastructure problems, not people problems.
1. Estimation failure: Actual effort consistently exceeds planned effort on similar project types. Symptom: positive effort variance on 60% or more of same-type projects. Fix: retrospective template analysis comparing planned vs. actual by phase across the last 12 projects.
2. Scope governance failure: Scope expanding without corresponding budget or timeline adjustment. Symptoms: rising non-billable time, growing task count after week 4, and informal client agreements outside the change-order process. Fix: define unplanned-work thresholds in the SOW that trigger written change orders.
3. Resource mismatch: Projects staffed with the wrong seniority level or skill set. Symptoms: high rework rate, extended review cycles, senior resources doing work scoped for junior delivery. Fix: introduce a skills-and-seniority check into staffing decisions.
4. External dependency mismanagement: Client-caused delays absorbed as internal schedule slippage. Symptom: on-time internal tasks but late milestones, with client task completion below 70%. Fix: tag every task by responsibility and track client task completion as a distinct metric.
5. Visibility lag: Problems known informally but not captured in the performance system. Symptom: projects flipping from green to red in a single week. True deterioration is gradual; a sudden flip means data was lagging. Fix: automate health scoring from actual delivery data.
6. The performance assessment cadence: Build project performance evaluation into every phase gate, not only at project close. Phase-gate reviews surface root causes while there is still time to act.
Both patterns share one origin: performance management treated as reporting rather than delivery governance. Performance data that arrives after decisions are made describes what went wrong, not how to prevent it. Organizations that consistently protect margin keep their performance data live, automated, and in front of decision-makers.
How do you improve project performance? 8 strategies that work for PS teams

A project performance improvement plan is not one initiative. It is eight interconnected disciplines that drive sustained project management improvement. Standardizing processes and templates not only improves current project performance but also streamlines the planning and execution of future projects, ensuring consistency and ongoing success.
Most professional services organizations improve one or two and wonder why portfolio performance does not shift. Teams that move the needle implement all eight as a system.
1. Build delivery templates from actuals, not from aspirations
Mechanic: After every 10 projects of the same type, compare planned vs. actual duration by phase. Use project templates and comprehensive documentation to standardize processes and capture lessons learned. Update the template to reflect observed reality, not the timeline sales hoped for.
What breaks without it: The same project type misses the same phase deadlines repeatedly because pattern data sits in unread post-mortems.
2. Replace self-reported project health with automated scoring
Mechanic: Calculate project health from schedule (SPI), financial (budget vs. scope), and client (overdue tasks, CSAT) data. Disable manual overrides without documented justification.
What breaks without it: Leadership sees green dashboards two weeks before red escalations. The self-reporting failed, not the data.
3. Track client-caused delays separately from internal delays
Mechanic: Tag every task by responsibility (internal, client, partner). Weekly review surfaces client task completion rate as a distinct metric.
What breaks without it: Delivery teams absorb client delays into their performance record. Utilization and margin suffer.
4. Set formal scope governance thresholds before projects begin
Mechanic: Define in the SOW: unplanned work above a defined threshold requires a written change order. Specify what qualifies and who approves.
What breaks without it: Scope expands through informal agreements. By month 3, the team delivers 25% over scope on the original contract.
5. Move from weekly status meetings to exception-based management
Mechanic: Configure alerts for intervention triggers: SPI under 0.85, burn 10+ points ahead of scope, client tasks overdue past 5 days.
What breaks without it: PMs spend hours compiling status weekly. Leadership reviews 20 projects in 90 minutes. The 3 that need attention get none.
6. Standardize the sales-to-delivery handoff with structured documentation
Mechanic: Build a handoff template capturing customer commitments, technical requirements, stakeholder map, and known risks. Make completion a required CRM step before kickoff triggers.
What breaks without it: Delivery teams start every project reconstructing information sales already collected.
7. Connect resource allocation to project financial performance in real time
Mechanic: When staffing, surface cost rate impact and margin implication alongside availability and skills. The PM sees the financial consequences before confirming.
What breaks without it: PMs optimize for availability and skills. Finance discovers the margin damage at month-end, too late to change.
8. Use phase-gate retrospectives to feed continuous improvement
Mechanic: At every phase completion (not only project close), run a 20-minute retrospective. Cover planned vs. actual duration, variance cause, and template changes. Findings feed template updates.
What breaks without it: Delivery organizations repeat the same phase-level failures. Template accuracy never improves because phase data never feeds back.
What are healthy project performance benchmarks for professional services?
Project performance benchmarks give professional services leaders the context that raw metrics alone cannot provide. The ranges below apply across B2B SaaS, consulting, and technology services organizations in North America, Europe, and APAC.
Absolute values differ across markets; performance ratios stay consistent. The number of projects completed successfully is also a key indicator of project management effectiveness, especially when those projects are delivered under budget or ahead of schedule.
PMI (PMI.org) research shows that organizations with mature project performance practices waste nearly 28× less investment in poor performance than those with low maturity, underscoring why continuous measurement, not annual review, is the operating model that protects margin.
- The utilization nuance: Consistent utilization above 80% is not a performance success. It is a burnout and quality risk. Sustainable high performance requires a 15% to 20% capacity buffer for unplanned work, governance, and continuous improvement.
- The margin reality: A professional services organization averaging 30% gross margin can discover projects mid-flight at 18% margin. That is a visibility problem, not a delivery problem. The margin erosion happened weeks before the number appeared, and the team did not have data fast enough to act.
- How to use these project management benchmarks: Pull your own portfolio numbers and compare ratios, not absolute values. Identify which dimensions deviate furthest from healthy ranges. That gap is your project performance improvement priority list.
Why does project performance break down as PS organizations scale?

Project performance problems at scale are usually diagnosed as people problems. They almost always turn out to be infrastructure problems. Inadequate risk management at this stage can lead to project failure, as organizations face increased complexity and exposure to threats that, if not identified and mitigated, can derail even well-planned initiatives.
Four failures show up again and again across professional services organizations as they grow.
- The tool sprawl problem: Smartsheet for project plans, OpenAir or Harvest for time tracking, Excel for resource allocation, Salesforce for revenue, QuickBooks for financials. None share data in real time. Project performance measurement requires manually assembling data from five sources before the picture is even current. PS leaders describe this as “a messy combination of tools with no single source of truth.”
- The hero consultant problem: In many PS organizations, 2 to 3 hero consultants hold performance together. They know the clients, the edge cases, and the workarounds. When they leave, performance drops, because the methodology was never documented or systematized. This is fine at 20 projects. It is fatal at 80.
- The self-reporting problem: Project health depends on PMs accurately updating dashboards. A PM running 6 projects, chasing timesheets, and handling escalations cannot match the rigor of a PM running 2. The performance system is only as good as its least diligent contributor.
- The scale tax: At 20 concurrent projects, manual performance management is difficult. At 80, it is impossible. The same processes that worked at scale 1 create a 40-hour-per-week reporting overhead at scale 4. The tax stays invisible until it has already destroyed delivery capacity.
PS leaders at scale describe the symptoms in similar terms. The phrasing repeats: “can’t answer basic questions about delivery performance,” “constantly firefighting,” “projects going red without advance notice.” The diagnosis is rarely individual performance. It is structural.
How do project performance tools compare for PS teams?
The table below compares how four widely used platforms cover the capabilities that drive project performance in professional services. Generic work-management tools handle tasks well; PSA-native platforms add the financial, resource, and client dimensions that PS delivery requires.
G2 ratings reflect average user scores as of 2026; vendor capabilities verified against public product documentation.
Which tool is right for you? (Decision routing)
How does Rocketlane improve project performance for PS teams?
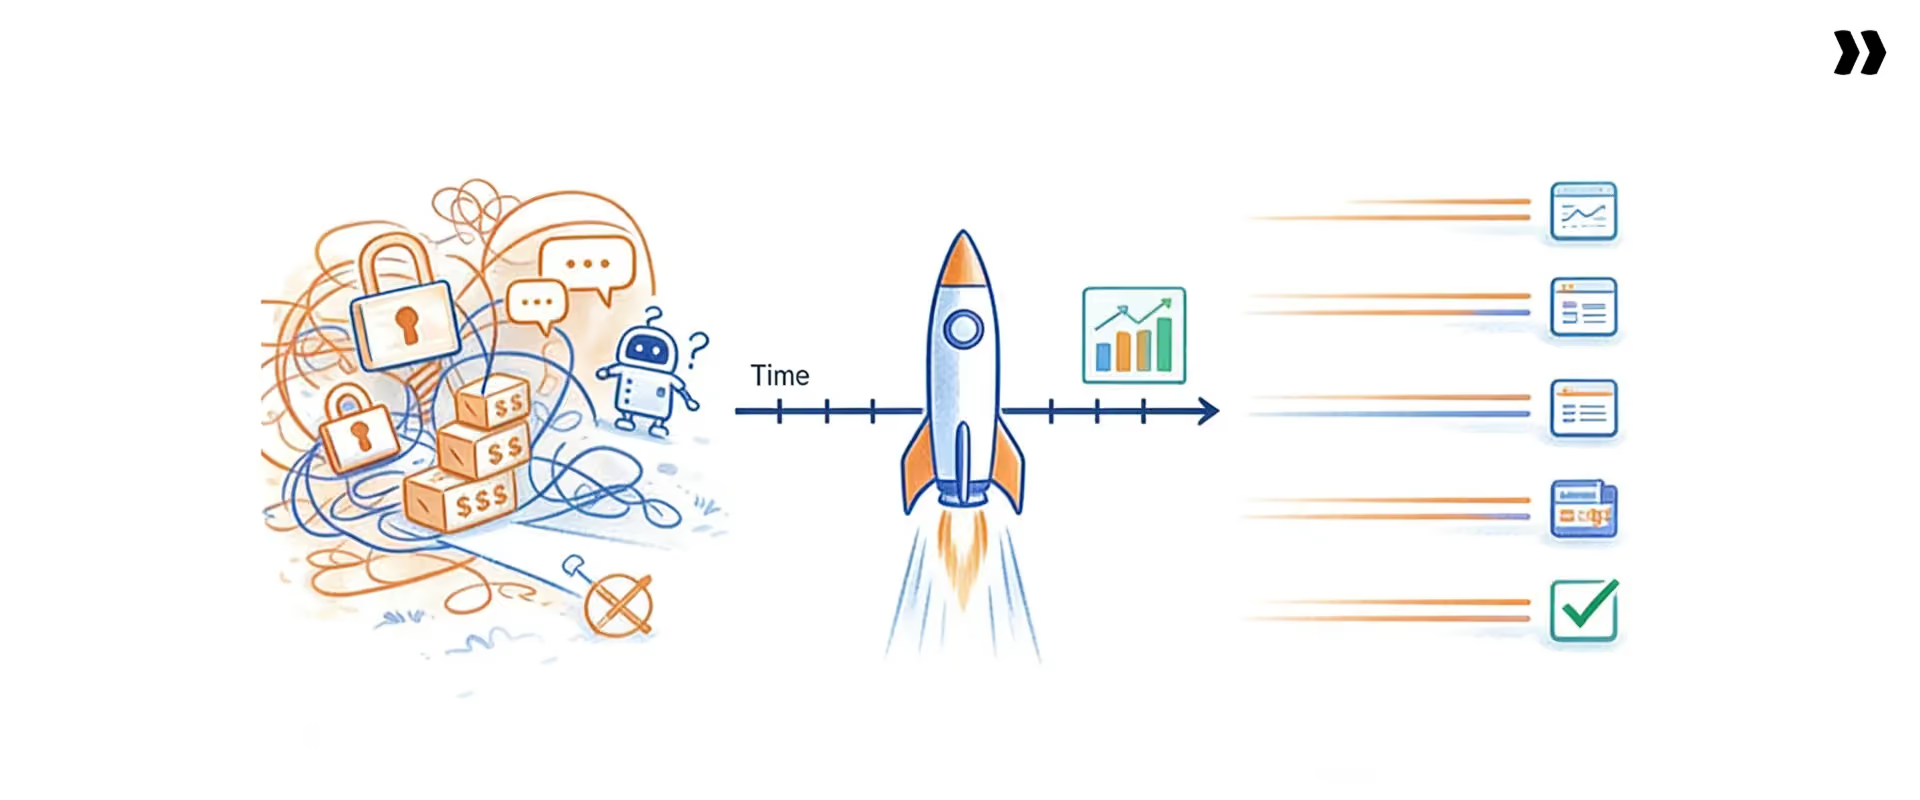
Rocketlane is an Agentic AI-powered PSA platform for customer-facing professional services teams. It integrates project delivery, financial management, resource allocation, and client collaboration into a single system.
By integrating delivery, financials, and collaboration, Rocketlane's project management tools enhance project efficiency and contribute to overall success. The structural problems that break project performance at scale dissolve when delivery, financial, and client data live together. Real-time updates close the visibility gap.
Automated Project Health Scoring: No More Green Dashboards That Go Red Overnight
The most common project performance failure is not a surprise. It is a delayed signal. Projects that flip from green to red did not deteriorate overnight. The data lagged behind reality for weeks.
What Rocketlane does: Rocketlane automatically calculates project health from delivery and financial data, including SPI, budget consumption, overdue milestones, and CSAT. RAG status updates continuously. Automated alerts fire when projects cross thresholds (80% budget consumed, SPI below 0.85, milestones overdue) before the weekly review.
Outcome: Leadership sees which projects need intervention before the PM escalates. Reactive firefighting becomes proactive governance.
Real-Time portfolio performance dashboard
When the CEO asks, "How is delivery performing?" the answer should not require a Friday-afternoon data sprint.
What Rocketlane does: A customizable portfolio dashboard displays all active projects and key performance indicators in a single view. Health status, budget consumption, schedule variance, utilization, and revenue at risk update in real time. Drill from portfolio to project to phase to task in one click.
Outcome: Leadership has a live performance picture. The weekly reporting sprint ends.
Operational insights: template performance that improves automatically
PS organizations that rely on intuition to estimate repeat the same phase-level failures indefinitely. The data that would fix the estimation sits in completed project records nobody analyzes.
What Rocketlane does: The Operational Insights report analyzes every project run against a template and shows planned vs. actual duration by phase. The system flags consistently overrunning phases automatically. The feedback loop enables templates to reflect observed reality rather than initial optimism.
Outcome: Estimation accuracy improves quarter-over-quarter. New projects benefit from the lessons of completed ones.
Client performance visibility through the customer portal
Client-caused delays are the most common untracked project performance variable in PS delivery. Teams know clients are behind, but the delay shows up as internal schedule variance.
What Rocketlane does: The branded customer portal gives clients visibility into their tasks, milestones, and required inputs. Automated reminders fire as client tasks approach due dates. Client task completion is tracked separately from internal delivery.
Outcome: Client accountability improves. The delivery team's performance record reflects internal execution, not absorbed client delays.
Resource performance connected to financial performance
Resource allocation decisions often look right tactically and wrong financially. The PM did not see the margin implication at the moment of staffing.
What Rocketlane does: When allocating resources, PMs see cost rates, utilization impact, and projected margin effect alongside availability and skills. The Resource Management agent suggests optimal team composition for load balancing or margin maximization. Capacity vs. pipeline demand is forecasted by role, with pipeline data pulled from Salesforce or HubSpot.
Outcome: PMs make staffing decisions that protect margin in real time.
Customer outcomes track the platform's impact: Hapi Cloud hit 85% billable utilization, Gamify reduced implementation timelines from 6 months to 30 days, and GoCardless accelerated time-to-value by 20%.
How does Rocketlane Nitro transform project performance management?
Rocketlane gives professional services teams real-time project performance visibility. Nitro takes it further. Nitro agents catch risk signals before they surface in metrics. They enforce governance automatically. They answer performance questions in plain language from live data.
Rocketlane Nitro provides a comprehensive framework for continuous improvement in project performance management, ensuring teams can proactively address risks and optimize outcomes.
How does AI change project performance management for PS teams?
AI changes project performance management by shifting governance from periodic review to a continuous, automated discipline. Instead of assembling performance data after delivery decisions are made, AI agents monitor project activity in real time.
They detect risk signals from client conversations before metrics catch them. They enforce governance policies at the point of execution. And they answer performance questions in plain language from live data. The result is project performance management that operates continuously, not weekly.
Project governance: performance standards that enforce themselves
The problem: Project governance breaks down at scale. PMs cannot consistently complete checkpoints, update statuses, and flag issues across every project, every week. Manual review queues create their own delay.
What it does: The Project Governance monitors active projects against defined policies. It blocks phase advancement without required sign-offs. It prevents closure when there are open issues or unpaid invoices. It flags budget burn running 15+ points ahead of scope. Policies are defined in plain language.
Example: A PM marks UAT complete before the client's sign-off is attached. The agent blocks the action and routes it for resolution.
Outcome: Performance standards stay consistent across projects, PMs, and geographies because the system enforces them, not individual discipline.
Nitro Signals: performance risk detection from client conversations
The problem: The earliest performance risk signals appear in client conversations. By the time those signals reach metrics, the project's trajectory has already changed.
What it does: Nitro Signals monitors client calls and emails for risk indicators: disengagement, scope expansion, relationship friction, stakeholder changes. It surfaces them as early warnings before they manifest in SPI, CSAT, or budget variance.
Example: A client stakeholder mentions a role transition in three weeks. The agent flags it as a continuity risk so the PM can restructure the go-live timeline early.
Outcome: Nitro Signals catches performance risk at the conversation layer, 2 to 3 weeks before it appears on any performance dashboard.
What to know before you buy Rocketlane
1. “Is it more expensive than a generic PM tool?” Yes per seat, but total cost of ownership comes out lower once a 5–10 percentage point margin lift on a $5–10M services book is counted, typically $250K–$500K in annual savings. The right comparison is margin protected, not seat price.
2. “Will my finance team be able to get the reports they need?” Yes. Nitro Analyst answers performance questions in plain language from live data, margin by service line, utilization by role, projected EAC by portfolio, without a report builder or SQL.
3. “What’s the learning curve for PMs?” PMs typically reach productivity within 1–2 weeks through the playbook library, which provides pre-built templates for onboarding, implementation, and recurring engagements that codify best practices rather than forcing teams to build from scratch.
4. “Isn’t Rocketlane just an onboarding tool?” No. Rocketlane is a full PSA platform spanning project delivery, resource management, time tracking, financials, customer collaboration, and Nitro agents, covering the entire post-sale services lifecycle, not just customer onboarding.
AI analyst: performance intelligence without the reporting queue
The problem: Answering a complex performance question requires a custom report, a data export, and an afternoon in Excel. By the time the answer is ready, the next quarter's staffing decisions are already made.
What it does: Ask the AI Analyst in plain language. Examples: "Show me active projects where SPI is below 0.85, and projected margin is below 20%." Or: "What is our average TTV trend for enterprise engagements this quarter vs. last?" The Analyst returns structured, real-time answers with drill-down to contributing projects.
Outcome: Every stakeholder has on-demand performance intelligence, without a reporting specialist in the loop. Plain-language queries replace the weekly reporting cycle.
Conclusion
Project performance is not the number on the dashboard. It is how fast you can see the truth behind it.
The professional services teams that protect margin are not the ones with the most disciplined PMs or the most detailed reports. They are the ones who stopped treating performance as something you assemble after the fact and started treating it as something you govern in real time.
Five dimensions, watched together. Leading indicators, caught while there is still room to act. One system, not five, so the picture is current when the decision is made.
Everything in this guide points to the same shift: from reporting what already happened to governing what is about to happen. That shift is what separates the organization that discovers a 15% margin in a post-mortem from the one that corrected it in week six.
The green dashboard that goes red overnight was never a delivery failure. It was a visibility failure. Close that gap, and performance stops being a surprise you explain and becomes an outcome you shape.
Table of Contents

Regsiter for the live webinar


Great consultants didn't join your team to spend Fridays writing documentation.
Table of contents
18 of Forbes Cloud 100 chose Rocketlane. The best PS teams aren't waiting around.
FAQs
What is project performance in project management?
Project performance in project management is the ongoing measurement of how effectively a project is executing against its planned objectives, covering schedule adherence, budget control, resource utilization, delivery quality, and customer satisfaction. In professional services, project performance includes a client experience dimension that generic PM frameworks miss. A project that finishes on time but leaves the client feeling uninformed has underperformed regardless of what metrics show.
What is project performance management?
Project performance management is the structured discipline of setting performance baselines, continuously monitoring progress against those baselines, identifying deviations before they compound, and taking corrective action while there is still time to act. It is a continuous governance function, not a monthly reporting exercise. Effective project performance management requires automated data collection, leading indicators that predict problems, and thresholds that trigger corrective actions.
How do you measure project performance?
Project performance is measured across five dimensions: schedule performance (SPI, on-time milestone rate), financial performance (margin, budget variance, CPI), resource performance (billable utilization, allocation accuracy), delivery quality (rework rate, governance checkpoint completion), and customer satisfaction (CSAT at milestones, time to value, client task completion rate). Effective measurement establishes baselines before projects begin, automates data collection, and tracks leading indicators alongside lagging ones.
How do you improve project performance in professional services?
Improving project performance in professional services requires eight connected disciplines: building delivery templates from historical actuals, replacing self-reported health status with automated scoring, tracking client-caused delays separately from internal performance, setting scope governance thresholds in every SOW, moving from status meetings to exception-based management, standardizing sales-to-delivery handoffs, connecting resource allocation to financial performance in real time, and using phase-gate retrospectives to feed template improvement.
What are the key performance indicators for project performance?
The key KPIs for project performance in professional services are: Schedule Performance Index (SPI), on-time milestone rate, project gross margin, billable utilization rate, budget variance, CSAT at key milestones, time to value, client task completion rate, and rework rate. These nine indicators cover all five performance dimensions. They provide both leading signals (SPI, client task completion rate) and lagging confirmation (final margin, go-live CSAT).
What is project performance assessment?
Project performance assessment is the systematic diagnosis of why project performance is deviating from plan, identifying root causes across estimation accuracy, scope governance, resource alignment, external dependency management, and data visibility. Effective assessment distinguishes problems caused by internal execution from those caused by external factors like client delays or scope changes. The corrective action for each is completely different.
What is a project performance improvement plan?
A project performance improvement plan is a structured action plan that identifies specific performance gaps, their root causes, and defined corrective actions with owners and timelines. An effective plan for PS teams addresses four root causes: template accuracy, governance policies, data infrastructure, and resource allocation. One improvement plan covering all root causes simultaneously is more effective than multiple disconnected initiatives.
What tools are used for project performance management?
Project performance management tools range from spreadsheets to PSA platforms. Spreadsheets create data lag and manual overhead that make real-time tracking impossible above 20 to 30 projects. Generic project tools like Asana or Monday handle tasks but lack financial and resource performance dimensions. Purpose-built PSA platforms connect delivery, time tracking, resource management, and financial performance in one system. They enable automated health scoring, real-time visibility, and AI-powered performance governance
What are healthy project performance benchmarks for professional services?
Healthy PS benchmarks: on-time milestone rate 80% to 90%, billable utilization 65% to 75%, project gross margin 28% to 40%, SPI 0.9 to 1.1, and rework below 10%. Compare your portfolio ratios against these, not absolute values, to find your improvement priority.
How does AI improve project performance management?
AI shifts governance from periodic review to a continuous, automated discipline. Agents detect risk signals in client conversations before metrics catch them, enforce delivery policies at the point of execution, and answer performance questions in plain language from live data, so intervention happens weeks earlier.













Copyright © 2026 Rocketlane Corp. All rights reserved.



















.webp)