Resource underutilization in professional services: how PS delivery teams identify, measure, and eliminate idle capacity in 2026



•
•
Summarize blog with






Introduction
It is a Friday afternoon. The VP of Operations at a 140-person SaaS implementation firm has spent six hours this week manually reconciling timesheets, pulling utilization data from three Excel tabs, and still cannot answer two questions her CFO will ask Monday morning: how much bench time is the team carrying right now, and do they need to hire in Q2? Her team runs across people and finance functions that were never designed to talk to each other.
She knows the answer is somewhere in the data. The data is in four systems that do not talk to each other. She marks the report "provisional" and sends it anyway.
The problem is not that underutilization exists. It is that by the time it surfaces, the idle payroll cost has already compounded.
What is resource underutilization in professional services?
Resource underutilization in professional services occurs when delivery team members have available capacity that is not generating billable work, resulting in payroll costs without corresponding revenue. It is distinct from planned bench time or deliberate investment work. Underutilization is the capacity gap teams fail to detect before the cost compounds.
Most PS leaders can name their utilization target. Far fewer can tell you, right now, which delivery team members are tracking below it and by how much. That gap between knowing the number and seeing the data in real time is exactly where underutilization hides.
It helps to separate underutilization into three distinct forms, because each requires a different fix.
Visible bench time is when a consultant is explicitly unallocated between projects and both the manager and the consultant know it. This is the easiest form to address because at least it is known.
Hidden underutilization is when a resource is nominally allocated to a project, but the project has slowed, wrapped a phase early, or has a skills mismatch that means they are filling time rather than generating value. This is the most expensive form because neither the PM nor the resource necessarily flags it.
Demand-gap underutilization is structural: the pipeline is thin or delayed, creating an under-demand situation that better allocation alone cannot solve. This is a forecasting problem, not an allocation problem.
What are the three dimensions of underutilization that affect PS delivery teams?
The human resources literature on underutilization identifies three dimensions: skill underutilization, time-related underemployment, and the burnout risk that results from mismanaging both. In a PS delivery context, each maps to a specific operational failure.
Skill underutilization is when a senior solution architect is assigned to work that calls for a junior analyst. The architect's bill rate does not match the value delivered, the project margin erodes, and the architect disengages professionally. In firms without a searchable skills matrix integrated into resource allocation, this happens by default when "whoever is available" gets staffed. Expertise remains underused, and the project pays a premium for it.
Time-related underemployment occurs when a consultant is allocated at 60% capacity, while their project and skill profile could support 80% to 85%. The gap between allocation and target is invisible without real-time resource usage data and typically surfaces only during monthly utilization reporting, weeks after the revenue has already been lost.
Burnout as the inverse problem. A team that oscillates between 120% utilization on one project and 50% while waiting for the next one faces both margin loss and a serious risk of burnout. The goal is consistent utilization within the target range, and that requires forecasting, not just monitoring.
What are the main causes of resource underutilization in PS delivery teams?

The four most common causes of resource underutilization in PS delivery are: skills mismatch (the wrong person allocated to the project), poor resource allocation visibility (no real-time view of who is available), stagnant workflows (projects that slow without detection), and weak pipeline forecasting (demand gaps that create structural bench time).
Each cause produces a different type of idle capacity, and each shows up in a different place in the data.
Skills mismatch
Resource allocation driven by availability rather than fit produces two outcomes: a senior consultant doing junior work, which erodes margins, or a junior consultant assigned to a task requiring senior expertise, which creates quality risks and rework. Gartner reports that over 60% of professional services leaders struggle with skills-based allocation across concurrent projects.
In firms that rely on spreadsheets and institutional memory for resource scheduling, the default is always "who's free" rather than "who's right," and the result is ineffective resource allocation that quietly compounds across dozens of active projects. Expertise remains underused on both sides: the senior consultant on work beneath their level, the junior consultant on work above theirs.
Poor resource allocation visibility
When resource managers work from a spreadsheet updated every Monday morning, the picture is stale by Wednesday. Projects shift timelines, phases complete ahead of schedule, new work comes in, and the allocation view does not update.
The result is that employees are underutilized, at 60% capacity, while a project three rows down in the same spreadsheet is understaffed. The issue is not effort. The tools were not built for real-time resource management.
Stagnant workflows that hide idle time
A project reaches a waiting phase: client approval, delayed access to the environment, and a stakeholder review, with the allocated consultant left in limbo. They are nominally on the project, not generating value.
Without a system that monitors project health and flags phase drift, the resource waits, the clock runs, and the margin drops. This is the hardest form of underutilization to detect because it appears to be utilization on paper.
Weak pipeline forecasting
When a PS firm cannot see which deals are closing in the next 60 to 90 days, it cannot plan capacity ahead of the gap. The result is a team at 90% utilization this month and 55% next month, not because allocation is poor but because demand forecasting is absent.
Future resource needs become visible only as staffing emergencies. Hiring decisions made without that 3-month view compound the problem: teams are hired for projected demand, projects slip, and idle resources accumulate on the bench.
How does resource underutilization affect profitability in professional services?

Resource underutilization erodes PS firm profitability through three mechanisms: idle payroll costs from unallocated capacity, margin compression from skills mismatches on active projects, and opportunity costs when senior consultants' time is absorbed by work that does not require that level of seniority.
These three mechanisms compound each other quietly, which is why the financial damage is discovered at month-end rather than prevented in advance.
Idle payroll cost
Every week, a consultant sits below the billable target; the firm pays their salary without recovering it through client billing. The leverage effect is direct: a 1% improvement in billable utilization produces approximately a 20% increase in operating profit for a typical PS firm, per Kantata's analysis.
At 100 consultants each carrying 5% more idle time than the utilization target, the compounded revenue gap is material by quarter-end.
Margin compression from skills mismatch
When a principal consultant is allocated to work that calls for a mid-level analyst, one of two things happens: the project bills at the principal's rate (the client pays a premium they did not expect and questions the value), or the project bills at the analyst rate (delivering the principal below market, direct margin erosion).
Neither outcome is sustainable across a portfolio. This is why underutilized resources affect profitability not just through idle time but through misaligned deployment.
Opportunity cost of senior resource misallocation
A partner or senior consultant spending 30% of their time on administrative coordination, status reporting, or junior-level delivery tasks is generating below-potential margins for each of those hours.
Reallocating that capacity to billable strategic work directly improves margin rate without adding headcount. Most PS firms do not track this systematically, which is why it stays a hidden cost.
Research from Mosaic found that PS organizations using a PSA platform achieve 24% higher project margins and 10% higher billable utilization than those without a PSA platform. The gap between manual and systematic resource management is not a rounding error. It is a structural profitability difference.
What is the difference between underutilization and overutilization in professional services?
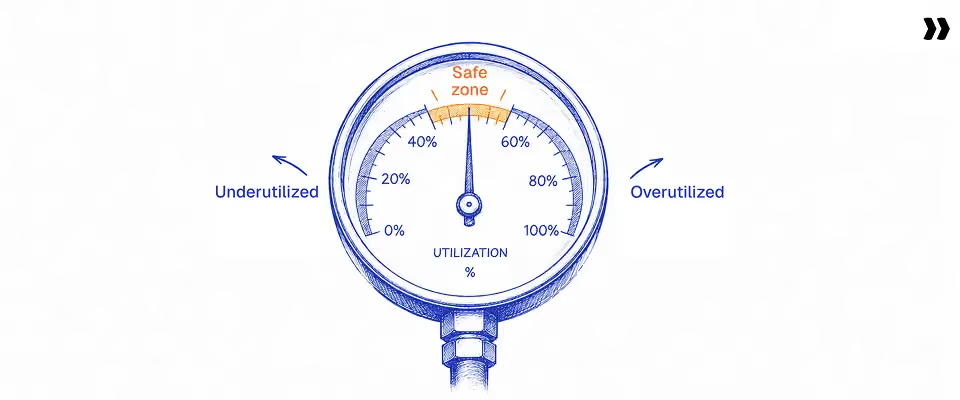
Underutilization occurs when delivery team members have capacity that is not generating billable work, resulting in idle payroll costs and margin loss. Overutilization occurs when team members are allocated beyond sustainable capacity, creating burnout risk, delivery quality decline, and attrition.
The goal is not maximum utilization. A team consistently running at 100% allocation is heading toward attrition, missed project deadlines, and a decline in quality. And a team oscillating between overload and idle time damages workforce productivity across both cycles.
The goal is optimal resource utilization sustained within the target range, and that requires active monitoring in both directions.
The target zone is where the margin is maximized without burning out the team. Getting there and staying there requires forecasting, not just monitoring.
How do PS managers identify underutilized resources before it becomes expensive?

PS managers identify underutilized resources early by monitoring four leading indicators: allocation gaps in the forward schedule, project phase completion rates outpacing the next phase start, timesheet variance between submitted and allocated hours, and pipeline-to-capacity coverage ratios showing demand shortfalls 60 to 90 days out.
The keyword is "early." The managers who catch underutilization before it becomes expensive are not looking at different data than everyone else. They are reviewing it sooner and acting on it faster. Tracking the right leading indicators is what separates reactive from proactive teams.
Forward allocation review
Check how far ahead each resource has confirmed work. A consultant with confirmed allocation through week three and nothing beyond is a bench-time risk that is two weeks from becoming a real cost.
A healthy forward allocation picture shows four to six weeks of confirmed allocation for core delivery team members, with eight to twelve weeks of soft allocation for senior consultants tied to active pipeline deals. If the scheduling tool only shows the current week, the signal cannot be seen until it is too late.
Timesheet variance monitoring
When a consultant is allocated to a project at 80% capacity and submitting timesheets at 50%, that is a hidden underutilization signal. The allocation says one thing.
The hours say another. Without automated variance monitoring, this discrepancy only surfaces at month-end when the PM reconciles actuals.
Project phase completion signals
When a project phase closes ahead of schedule, the next phase may not be ready to absorb the allocated consultant immediately. That gap between phase completion and phase start is a structural underutilization risk.
Without project health monitoring that flags early phase completions, the resource reports they have nothing to do, and the manager finds out at the standup instead of before it happens. Setting phase-completion alerts that trigger a reallocation review gives project managers 10 to 14 days of lead time.
Pipeline-to-capacity coverage ratio
This is the 3-month forward look: the confirmed and high-probability pipeline value, as a percentage of team capacity cost, for the same period. If the pipeline covers 60% of next quarter's capacity planning, 40% of that capacity is at risk of underutilization, and hiring decisions made against optimistic close dates will compound it.
This ratio is the early warning system for structural bench time, and it requires connecting the sales pipeline to the resource plan, which most PS firms using separate tools cannot do in real time.
What strategies do high-performing PS firms use to reduce resource underutilization?
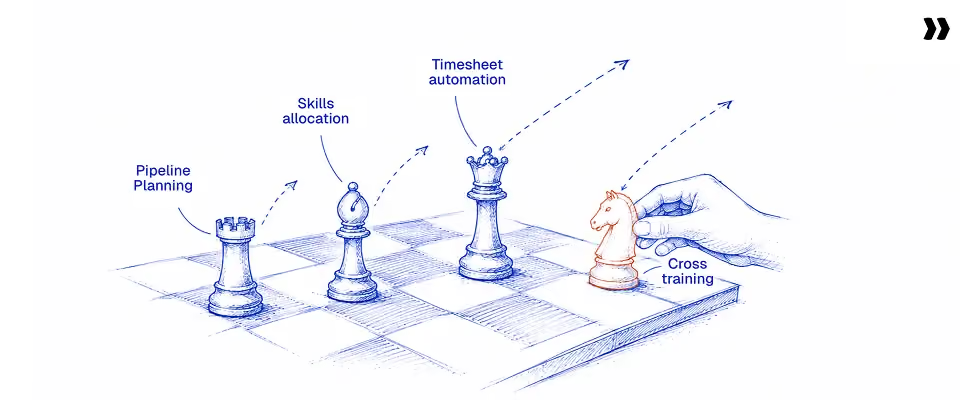
High-performing PS firms use four strategies to consistently reduce underutilization: capacity planning connected to pipeline forecasting, skills-based resource allocation that matches the right person to each project, automation of timesheet compliance and utilization reporting to surface idle capacity in real time, and cross-training programs that expand the deployable skill set when primary project demand is low.
These are not independent tactics. The firms that sustain resource optimization over time implement all four and treat them as a connected system.
Why does pipeline-connected capacity planning eliminate structural bench time?
Capacity planning that only accounts for confirmed projects will always lag demand. By the time a deal closes and a project spins up, the resource scheduling gap is already two to four weeks old.
High-performing PS firms connect their pipeline to their resource model at the probability level: for each deal above a set threshold, typically 50% to 70% probability, they model the resource demand it creates if it closes on the projected date. The result is a demand-supply view that shows future resource needs before they become urgent.
This changes two decisions that most PS firms currently get wrong: hiring (made with 90 days of visibility rather than last month's actuals) and bench management (started when the pipeline signals a gap, not after the gap opens). Implement strategies at this level, and the team stops reacting to capacity crises and starts preventing them.
Automating timesheet compliance and utilization visibility
The biggest reason utilization data is unreliable in growing PS firms is timesheet compliance. Memory decay reduces timesheet accuracy by 25% to 40% after 24 hours, which means timesheets submitted on Friday for a full week of work are already significantly inaccurate.
Policy enforcement at submission fixes this. Rules like project code validation, hours-per-day caps, mandatory notes for specific task types, and ramp-up period billability logic (0% billable in onboarding, 50% in month two, 100% from month three) can be configured once and enforced automatically at the point of entry, not at the end-of-month review when corrections are painful.
The downstream effect matters: reliable timesheet data yields reliable utilization reporting, which in turn yields reliable capacity planning. The Finance Manager who currently spends an entire day each month chasing and correcting timesheets gets that day back. The utilization report no longer carries a "provisional" caveat.
How does cross-training reduce bench time when primary demand drops?
A consultant with a single specialization is either fully deployed or on the bench. There is no middle range when their primary skill is in low demand. Cross-training widens the range of projects each consultant can support.
The prioritization is straightforward: map the skills most frequently in demand against the skills most frequently causing bench time. The gap between those two lists is the training priority.
A Salesforce specialist who develops competency in HubSpot can be deployed across a wider project pool during Salesforce pipeline gaps. Untapped skills that already exist in the team but are never surfaced because no one tracks them are a resource underutilization problem with a low-cost fix.
Even modest cross-training within an adjacent skill set materially changes the bench time equation. It also improves employee morale and job satisfaction among team members who want to grow, and encourages them to stay longer at firms that invest in their development.
Actively encourage employees to build adjacent skills as a structured practice rather than an afterthought between projects, and bench time profiles shift measurably.
Real-time utilization performance tracking
Monthly utilization reports are rear-view mirrors. By the time they are published, the decisions they should have informed have already been made from stale data.
The right tracking cadence is weekly at the individual and team level, monthly at the trend level, and quarterly at the pipeline-to-capacity level. Weekly utilization data gives project managers the signal they need to reallocate before a gap widens.
Monthly trend data shows whether the strategies above are working. Quarterly pipeline-to-capacity ratios shape hiring and bench management decisions before they become reactive.
Resource utilization trends tracked at this cadence provide valuable insights into patterns that are invisible in monthly snapshots: which practice areas consistently dip below target in Q1, which engagement types carry the highest skills mismatch risk, which project types generate the most hidden underutilization during waiting phases.
How should PS teams measure and track resource underutilization?

PS teams should track underutilization through five metrics: billable utilization rate, bench rate, forward allocation coverage, timesheet compliance rate, and pipeline-to-capacity ratio. Together, these five metrics give a complete picture of current underutilization, upcoming bench time risk, and structural demand gaps.
Billable utilization rate
The primary KPI. Most PS firms set targets in the 70%-85% range, with the industry average at 68.9% in 2024.
Resource utilization formula: Billable hours logged / Total available hours x 100 = Billable utilization rate
Underutilization rate formula: (1 - Billable utilization rate) x 100 = Underutilization rate. If billable utilization is 72%, the underutilization rate is 28%, the share of paid capacity not generating client revenue in that period.
The denominator matters. Available hours should be calculated after approved PTO and public holidays are removed, not as a flat 40-hour-per-week maximum. Using max capacity as the denominator overstates availability and makes utilization appear lower than it actually is.
Bench rate
Bench rate and billable utilization rate are inverses at the individual level but diverge at the portfolio level. A team can show 80% average billable utilization while specific team members sit at 30% bench time, concealed by the average.
Track both the average and the distribution. A low average with high variance signals that a few critical resources are carrying most of the billable load while others sit chronically underutilized.
Forward allocation coverage
The leading indicator is the percentage of the delivery team with confirmed allocations beyond the next four weeks. A healthy PS firm has 80% or more of its team with four-week confirmed coverage.
When that number drops below 60%, underutilization risk is material enough to pause hiring decisions and activate bench management. This metric surfaces future resource gaps before they arrive.
Timesheet compliance rate
This is the prerequisite for every other metric. Compliance is the percentage of timesheets submitted on time and with the correct project codes, without manual correction.
The SMB benchmark sits at 85% to 92%, but achieving 95% or higher is what produces the data quality needed for reliable utilization reporting. Below 80%, utilization data should be treated as directional rather than actionable.
Pipeline-to-capacity ratio
Confirmed and high-probability pipeline value for the next 90 days, expressed as a percentage of team capacity cost for the same period. Below 80%, structural underutilization risk is building in the next quarter.
Above 120%, the team is heading toward overutilization and hiring needs to accelerate. This ratio links sales activity to resource management, and most PS firms that use separate tools for sales and delivery cannot produce it without manual calculation.
Which approach to underutilization management is right for your PS team?
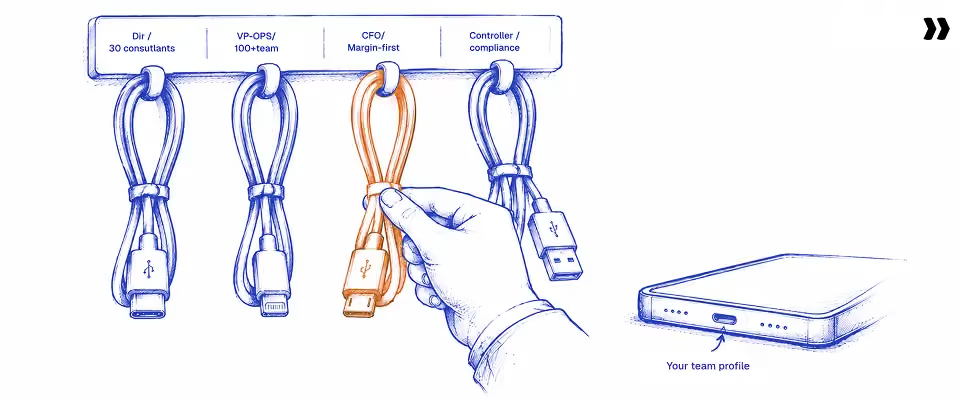
The right underutilization management approach depends on team size, current tool maturity, and whether visibility, allocation, or forecasting is the primary gap. Small teams need timesheet discipline; mid-size teams need real-time allocation visibility; growing firms need pipeline-connected capacity planning integrated into a single resource management system.
Which situation fits your team right now?
The inflection point is when underutilization tracking needs to integrate with capacity forecasting, resource allocation, and financial reporting within the same system. A 10-person consultancy can manage this with timesheet discipline and a well-maintained spreadsheet.
A 100-person PS firm managing 25 concurrent projects, with varying billability ramp-up periods, a live pipeline to staff, and a board asking about Q3 headcount projections, is running a problem that timesheet tools and spreadsheets were not designed to solve.
At that inflection, the complexity routes to a purpose-built PSA where utilization data, resource allocation, and pipeline forecasting share a single data model.
How does Rocketlane help PS teams eliminate resource underutilization?

Rocketlane addresses resource underutilization by combining real-time allocation visibility, pipeline-to-capacity forecasting, timesheet policy enforcement, and skills-based resource matching on a single platform, eliminating the manual reconciliation across spreadsheets, timesheets, and project data that keeps idle capacity invisible until it is expensive.
Rocketlane operates as an agentic execution platform for customer-facing PS delivery teams, not just a scheduling tool. The four capabilities below map directly to the four failure modes that cause underutilization in growing PS firms.
Rocketlane by the numbers
- 750+ customers across B2B SaaS and professional services
- 94% G2 recommendation rate
- $60M Series C (March 2026)
- Revenue more than doubled year-over-year
Two outcomes from teams that moved from manual resource tracking to a connected PSA:
A professional services firm managing 200+ delivery consultants was losing an estimated $500,000 annually in idle payroll cost before gaining real-time capacity visibility. After implementing PSA-driven allocation tracking, they increased billable utilization from 70% to 90% within six months, and end-of-month bench time surprises dropped to near zero.
A second SaaS implementation team reduced time spent on weekly resource reconciliation from six-plus hours to under 30 minutes. Delivery managers shifted that recovered time to client-facing work, and the team took on 20% more concurrent projects without adding headcount.
How does real-time allocation visibility replace the manual spreadsheet review?
In Rocketlane, the allocation picture updates continuously as projects change: phase completions, timeline shifts, new allocations, and HRIS-synced time-off all flow into the allocation view automatically. Nobody needs to refresh a spreadsheet on Monday morning.
The view shows current utilization by resource, team, and practice area alongside forward allocation coverage. A delivery manager can see which consultants are coming off projects in the next two weeks, who has confirmed work through the end of next month, and where the upcoming gaps are. Resource availability is visible before it becomes bench time.
For the VP of Operations who currently spends six hours a week building a utilization report from three Excel tabs, that six hours disappears because the report builds itself from live project data. No batch processing, real-time data flowing directly from project activity into the allocation view.
Skills-based resource matching
Rocketlane's skills matrix connects directly to the allocation engine. A request for a Salesforce consultant with CPQ experience, available from week three, at a specific cost rate, returns a filtered and ranked list of available resources rather than a conversation with a coordinator who needs to check their notes.
Resource management agent (currently in active rollout) extends this further by analyzing skills, current utilization, cost rates, and forward availability to surface the optimal team composition for incoming projects. Two optimization modes are available: load balancing to distribute work evenly and protect capacity, or margin maximization to find the most cost-effective team composition.
This directly addresses the skills mismatch problem. Staffing decisions driven by fit rather than availability help teams optimize resource allocation, achieve better margins, reduce quality issues, and ensure more consistent employee satisfaction across the delivery team.
Pipeline-connected capacity planning
Rocketlane integrates bidirectionally with Salesforce and HubSpot. Deals above a set probability threshold pull into the capacity planning view as provisional demand before they close. When a deal converts to a project, the resource demand it creates is already modeled in the schedule.
This gives operational leaders the 3-month forward look that the spreadsheet cannot provide. Hiring decisions and bench management actions are made against a demand forecast rather than last month's actuals. Future resource needs surface as pipeline signals rather than staffing emergencies.
The scenario planning layer lets resource managers run different close-date assumptions, compare team compositions, and model the margin impact of each before committing to an allocation. Scenario planning at this level separates firms that prevent capacity crises from those that respond to them.
Timesheet policy enforcement
Rocketlane's timesheet governance enforces compliance at submission, not at month-end review. Rules are configured once in plain language: project code validation, hours-per-day limits, mandatory notes for specific task types, ramp-up period billability logic, PTO integration with HRIS systems. When a submission violates a rule, the user receives specific, actionable feedback at the point of entry, not a correction email three weeks later.
The Finance Manager who currently spends a full day chasing and correcting timesheets at month-end gets that day back. The utilization data that feeds every other metric on this list becomes reliable at the moment of entry rather than after a manual reconciliation cycle.
According to SPI Research's 2024 Rocketlane co-published benchmark, PSA users see 8.2% higher billable utilization and 6.1% higher project margins after implementation. The platform does not create that gap through something exotic. It creates it by making existing resources more visible, deployable, and measurable than they were across four disconnected systems.
How does Nitro detect and prevent resource underutilization with AI?
Rocketlane's Nitro agents detect underutilization risk before it materializes through two levels of AI: Level 1 Operations AI, which delivers on-demand capacity intelligence and enforces timesheet compliance, and Level 2 Governance AI, which monitors project health signals that predict upcoming bench time before a resource goes idle.
Nitro represents a shift from merely tracking work to actively executing it. The difference from traditional reporting tools lies in the timing: Nitro surfaces the signal while there is still time to act, not after the cost has been incurred.
Level 1 Operations AI: capacity intelligence on demand
Three Level 1 agents are directly relevant to the detection and prevention of underutilization.
Resource management agent (currently in active rollout)
When a new project needs staffing, the Resource management agent surfaces best-fit candidates based on skills, availability, cost rate, and current utilization in seconds. Two modes: load balancing, which finds the least-utilized person matching the requirement and distributes work evenly, or margin maximization, which finds the most cost-effective match.
For bench management specifically, the Resource management agent answers "who is under 60% allocation next month with these skills?" without anyone needing to build a report. Right resource, right project, right cost, in seconds.
Nitro Analyst
A natural language interface into all portfolio data. Ask: Which consultants have a billable utilization below 70% this month? Which practice areas are tracking below target? Which resources are coming off projects in the next three weeks without a confirmed next assignment?
The answer comes from live data, not a manually assembled utilization report. The utilization picture that currently takes six hours to build takes 60 seconds to pull. Portfolio answers in seconds, without building a report.
Timesheet Policy Agent
Enforces timesheet governance at the point of submission: validates project codes, applies ramp-up billability rules, blocks non-compliant entries with specific feedback, and requires notes where the policy demands them.
The Finance Manager who spends a full day chasing and correcting timesheets at month-end gets that day back. The downstream effect is reliable utilization data from the moment it is entered. Compliance at point of entry, not at review.
Level 2 Delivery AI: project health signals that predict bench time
Nitro Signals (Project mode): Nitro Signals monitors project health signals across the active portfolio and surfaces patterns that predict when resources are about to go idle, before they actually do.
The signals relevant to underutilization: a phase completing faster than planned (the resource will be free earlier than the schedule assumes), a project entering a waiting phase where the consultant is allocated but generating no value, and a project timeline slipping in a way that creates a gap between the current engagement ending and the next one starting.
When one of these patterns appears, Nitro Signals flags it: Project X is on track to complete Phase 3 in week 8 rather than week 10, and the assigned resource will have available capacity starting in week 9 with no confirmed next assignment.
The PM gets 10 to 14 days of lead time to reallocate or staff the resource to a pipeline project. Without that signal, the idle capacity surfaces at the weekly standup on week 9, which is too late to prevent it.
Early warning, not post-mortem.
What to know before tackling underutilization at scale in your PS delivery operation
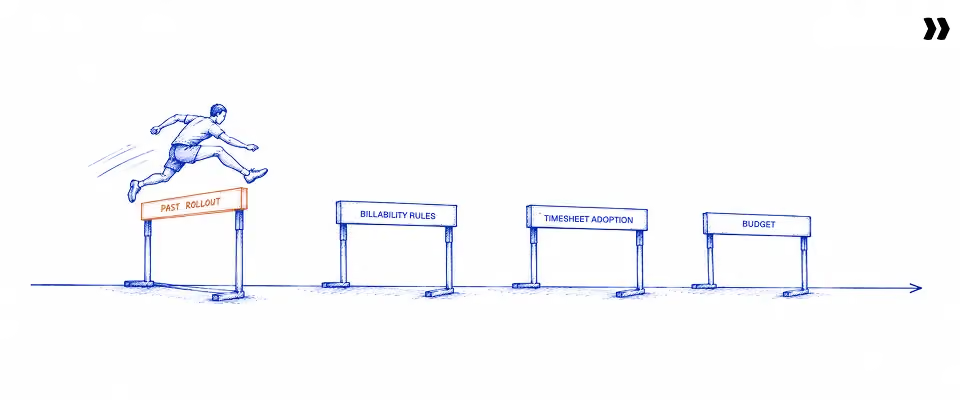
Four concerns consistently surface before PS firms commit to a platform-based approach to underutilization management: past PSA implementation trauma, complex billability rules that feel overly specific for a standard system, the risk of timesheet adoption, and the challenge of building a credible ROI case for a full PSA investment.
What to know before you buy
- Implementation approach: Start modular. Resource management first, financials second.
- Data migration: Parallel running is supported. No hard cutover required.
- Team adoption: Policy enforcement at submission replaces manual timesheet chasing.
- ROI timeline: Most PS firms see payback within 6 to 12 months from recovered utilization alone.
- Integration scope: Native Salesforce and HubSpot sync. HRIS via BambooHR. No middleware required.
Each of these concerns is legitimate. Here is how high-performing firms have worked through them.
Past implementation trauma
"I've been burned by a PSA rollout before" is one of the most common statements in PSA technology evaluations, and it is grounded in real experience. PSA implementations fail when they involve too many stakeholders, attempt a hard cutover, or try to configure everything at once.
The resolution is structural: start with resource management and capacity planning before touching financial reporting or the client portal. Parallel running is fully supported, so teams do not cut over until the new system has proven itself alongside the old one. Keep the implementation group small. Rollouts that fail usually involve too many decision-makers, not too few.
Complex billability rules
Ramp-up periods, site-constrained resources who cannot be in two places at once, multi-currency projects, and subscription-based variable demand: these are the scenarios that make PS leaders skeptical that a standard resource management tool will handle their actual workflow.
Rocketlane's timesheet governance is configurable at the rule level for all of these scenarios, in plain language, not through code customization. The rule is written once. The system enforces it consistently across all resources and submissions.
Timesheet adoption risk
The concern is real: if the team does not track time consistently, no utilization metric is reliable. Policy enforcement at submission changes the compliance dynamic.
Instead of a month-end review where corrections require reconstructing a week's worth of memory, non-compliant entries are blocked immediately with specific, actionable feedback. Time-tracking becomes a discipline the system enforces rather than one that depends on individual conscientiousness.
Building the ROI case
The board-level argument for a PSA investment comes down to quantifying the current cost of not knowing.
The investment case does not require a 10-year model. It requires calculating what the current utilization gap is costing, which is the same calculation a well-implemented PSA makes automatically to produce.
From hidden idle time to visible, actionable capacity
PS firms that manage underutilization proactively are not doing something fundamentally different from firms that discover it expensively at month-end. They are seeing the same data earlier, acting on it faster, and building systems that close the gap between available and deployed capacity before costs compound.
Three architectural shifts separate the firms that stay ahead of underutilization from those that chase it:
- From allocation tracked in Outlook and spreadsheets: A real-time workload view that updates as projects change, with forward allocation coverage visible six to eight weeks ahead. Resource scheduling decisions are made with current data, not last Monday's export.
- From timesheet reconciliation at month-end: Policy enforcement at submission produces reliable utilization data as soon as it is entered, not three weeks after the fact. Every downstream metric becomes more trustworthy as a result.
- From hiring and bench decisions made against last month's report: Pipeline-connected capacity planning shows demand gaps 10 to 12 weeks out, in time to make decisions rather than respond to consequences.
A 10-person consultancy can manage underutilization with timesheet discipline and a spreadsheet. A firm growing from 100 to 200 consultants, with a live pipeline, multiple practice areas, complex billability rules, and a board asking for Q3 headcount projections, is past the point where manual processes produce reliable data. Teams that make the shift to a purpose-built PSA stop discovering bench time and start preventing it.
The cost of staying manual is the hidden cost of underutilization. The cost of getting visible is a platform change that pays for itself in recovered margin. Rocketlane connects the resource allocation, timesheet compliance, and pipeline forecasting layers that growing PS firms currently manage across disconnected systems.
With a 94% G2 recommendation rate across 750+ customers, teams that make the shift stop asking "how much bench time are we carrying?" and start preventing the question from arising.
Table of Contents

Regsiter for the live webinar


Great consultants didn't join your team to spend Fridays writing documentation.
Table of contents
18 of Forbes Cloud 100 chose Rocketlane. The best PS teams aren't waiting around.
FAQs
What is resource underutilization in professional services?
Resource underutilization in professional services occurs when billable team members carry available capacity that is not generating client revenue. It differs from planned bench time: it is the capacity gap teams fail to catch before costs compound. Healthy PS firms target 70%-85% billable utilization as their sustainable operating range.
What are the main causes of underutilization in PS delivery teams?
The four main causes are skills mismatch (the wrong person fills a role), poor allocation visibility from stale spreadsheets, stagnant workflows that leave consultants nominally assigned but generating no value, and weak pipeline forecasting that creates structural bench time before demand gaps are visible to the resource management team.
How does underutilization affect profitability in professional services?
Underutilization hits profitability through three channels: idle payroll cost from unallocated capacity, margin compression when mismatched resources deliver below billing rate, and opportunity cost when senior consultants handle low-value work. SPI Research found EBITDA dropped from 15.4% to 9.8% as billable utilization hit 68.9%.
What is the difference between underutilization and overutilization?
Underutilization is capacity that does not generate billable revenue; overutilization is capacity stretched beyond sustainable levels. Both destroy margin: underutilization through immediate idle payroll cost, overutilization through delayed costs from attrition and quality decline. The target for most PS firms is 70%-85% sustained billable utilization.
How do PS managers identify underutilized resources before it becomes expensive?
PS managers identify underutilized resources early by monitoring four signals: forward allocation gaps beyond two weeks, timesheet variance where submitted hours fall short of allocated hours, project phase completions outpacing the next phase start, and pipeline-to-capacity ratios flagging demand shortfalls 60 to 90 days ahead.
How does bench time connect to underutilization in consulting firms?
Bench time is the visible form of underutilization where a consultant is explicitly unallocated. Underutilization is broader: it covers visible bench time, hidden idle capacity within active projects, and structural demand gaps. The pipeline-to-capacity ratio surfaces upcoming bench risk before it opens, giving managers lead time to act.
What strategies do PS firms use to reduce resource underutilization?
Four strategies consistently work: pipeline-connected capacity planning that models demand 60 to 90 days ahead, skills-based resource allocation to eliminate mismatch, automated timesheet compliance for reliable utilization data, and cross-training programs that expand each consultant's deployable skill set when primary project demand is low.
How does AI help professional services teams detect and prevent underutilization?
AI tools like Rocketlane's Nitro use the Resource Management Agent to match skills and availability in seconds, Nitro Analyst to answer capacity and portfolio questions in plain language without building a report, and Nitro Signals to flag project phase completions and stalled workflows that predict upcoming bench time before a consultant goes idle.
What is a healthy billable utilization rate for professional services firms?
SPI Research's benchmark shows the industry average billable utilization fell to 68.9% in 2024. Most professional services firms target a range of 70% to 85%, with available hours calculated after PTO and public holidays rather than a flat 40-hour weekly maximum. High-performers consistently operate in the upper end of that band.
How does a PSA platform help eliminate underutilization in professional services?
A PSA platform integrates allocation, timesheets, pipeline, and financial reporting into a single system, eliminating manual reconciliation that can hide idle capacity. SPI Research found PSA users achieve 24% higher project margins and 10% higher billable utilization. Rocketlane is purpose-built for PS delivery teams, with 750+ customers.













Copyright © 2026 Rocketlane Corp. All rights reserved.




















.webp)