Time to value in customer onboarding: a practical guide for professional services and implementation teams in 2026

•
•
Summarize blog with






The contract is signed. Someone posts the win in Slack. The account moves from pipeline to portfolio, and the celebration lasts about a day.
Then a project manager opens a blank template. They copy tasks from the last implementation and rebuild the plan by hand. Two weeks pass before the kickoff call happens.
By the time that customer reaches their first meaningful outcome, two months have passed. Most teams file this under complexity. It is not complex. It is structure, and structure can be redesigned.
Time to value is not a technical metric. It is the first impression your delivery organization makes, repeated across every new customer you sign.
What time to value in customer onboarding means and why it matters

Time to value in customer onboarding is the duration from contract signing to the moment a customer achieves their first measurable business outcome. It is not the date the implementation technically closes. For professional services and customer success teams at SaaS companies, time to value predicts renewal, expansion, and referral more directly than any other delivery metric.
The cost of getting it wrong is measurable. PMI's Pulse of the Profession research on requirements management is blunt about the cause. Inaccurate requirements are the primary reason projects miss their original goals 47% of the time. The stakes run past the project: Harvard Business Review notes that acquiring a new customer costs 5 to 25 times more than keeping an existing one.
High-performing teams share three habits. They define the value moment before kickoff rather than calculating it after project close. They track time to first value as a live milestone. They design the onboarding process so customer tasks cannot quietly stall.
Rocketlane is an agentic AI-powered PSA platform for customer-facing professional services teams. It serves 750+ customers with a 94% G2 recommendation rate.
This guide covers what time-to-value measures and where implementations lose weeks. It also covers the time-to-value metrics worth tracking, how to shorten TTV inside the onboarding flow, and how agentic AI compresses the delivery work itself.
What is time to value in customer onboarding, and why is it not the same as go-live?
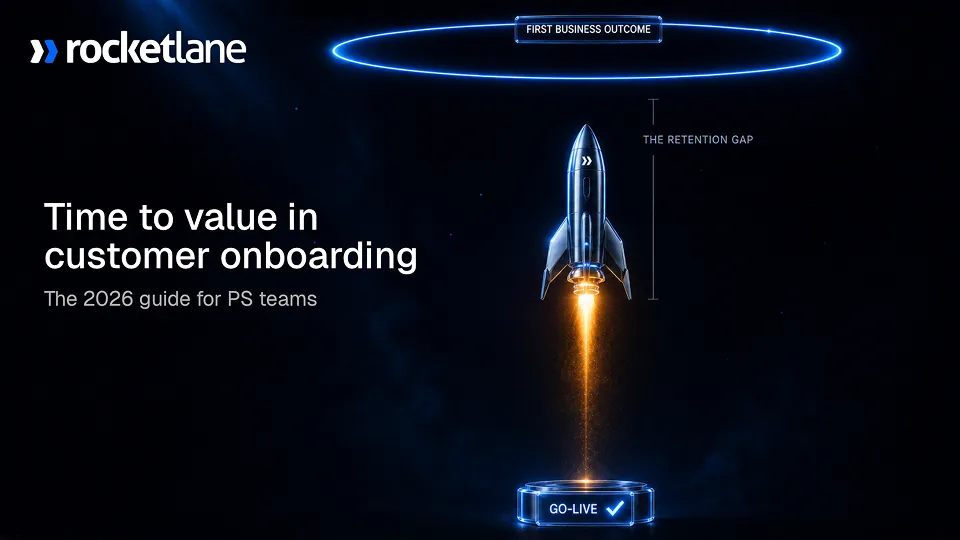
Time to value in customer onboarding is the duration from contract signing to the moment a customer achieves their first measurable business outcome. It is not the same as go-live. A customer can be technically live and still weeks away from the outcome they bought the product to deliver. The gap between those two dates is where retention is decided.
Search results for time to value are dominated by product growth content. That framing treats time to value (TTV) as an adoption idea inside a SaaS product. For implementation teams, the TTV definition has to be operational instead.
An operational definition needs three parts. A start point, which is the signature date. An end point, which is a defined value event agreed with the customer. And leading indicators you can track across every project running in parallel. Define TTV that way, and it becomes a managed number rather than a talking point.
The distinction matters across the whole customer journey. Time to value in SaaS sits between the sales promise and the renewal conversation. It shapes what new customers believe about your delivery organization long after go-live.
When the definition stays informal, every person measures something different. One counts from kickoff. Another counts from sign-up. A third counts from the first invoice. Nobody can compare two implementations, so nobody can improve either one.
Consider a typical case. A customer goes live on schedule in week eight, and the project closes green. Their first report does not run until week fourteen, because nobody agreed what that first report needed to contain. The implementation succeeded. The time to value did not.
Key definition
Time to value is the duration from signed contract to first measurable business outcome, not the date the implementation closes. It is the metric that predicts renewal: customers who reach their value moment on schedule expand and refer, while customers who wait disengage during the wait.
What are the different types of time-to-value, and which should teams measure?
Time to value is a spectrum, not a single number. Five types matter for onboarding and delivery teams, and each answers a different question.
- Time to first value (TTFV): The earliest measurable signal that a customer is on the path to their outcome. A first workflow run, a first report generated, or a first project tracked in the new system. TTFV is the leading indicator to define before kickoff.
- Immediate time to value: Value delivered inside the first session, immediately after account creation. This applies to products where new users reach a core benefit without configuration. Immediate value is realistic for self-serve tools and rare in enterprise implementations, which is exactly why the distinction is useful.
- Basic value, or short-term time to value: The customer's first outcome connected to the reason they bought. First team using the platform, first billing cycle run, first dashboard shared with a client. Most teams call this go-live, but it only counts as basic value if success criteria were agreed beforehand.
- Long-term time to value: Full return on the investment. Team-wide adoption, process change, and measurable improvement against the baseline captured at deal close. Renewal decisions are made against this number, and delays here affect customer lifetime value directly.
- Time to exceed value: The point where the customer derives more value than the contract price. This drives expansion and referral, and it is only reachable if the earlier value events landed on time.
Measure at least two of these. Track TTFV as your early-warning metric and long-term value as your renewal metric. Reporting only on go-live tells you when work stopped, not when value started.
Why the go-live date and the value moment drift apart
At most SaaS companies, revenue recognition is tied to go-live. Finance needs that date for time-to-revenue reporting, so that date gets tracked with real discipline.
The result is a quiet mismatch. The metric that gets measured is go-live. The metric that predicts retention is the value moment. Teams optimize for the one that appears in the forecast.
That is how implementations close on time on paper while the customer is still waiting. It also explains why churn sometimes arrives from accounts that every internal dashboard marked green. Customer expectations were set at signature, and the customer expects progress against those, not against your phase gates.
Why do professional services implementations take longer than planned?

Implementations run long for five connected reasons. Customer deliverables tracked in email with no accountability mechanism. A sales-to-delivery handoff that loses context. Manual project creation overhead at deal close. Complex integrations discovered mid-project rather than at scoping. And delivery risk kept in a separate document reviewed once a week.
The five root causes of slow time to value
- Customer dependency bottlenecks: The customer's data migration, access provisioning, and configuration decisions all sit on the critical path. Assigned by email with no due date and no dependency chain, they have no architecture around them. The project manager becomes the tracking system, sending a weekly follow-up that everyone finds uncomfortable.
- Sales-to-delivery handoff gaps: The project manager starts blank. Scope, stakeholders, integration requirements, and success criteria that the account executive captured over a six-week deal cycle sit in the CRM. The first two weeks get spent rediscovering what sales already knew.
- Manual project creation overhead: Copying templates and adjusting tasks adds 30 to 60 minutes per implementation at deal close. For a team running 30 concurrent projects, that overhead compounds. The implementation starts late because the project did not exist until someone had time to build it.
- Complex integrations found late: Multi-vendor integrations, API dependencies, and third-party timelines sit outside your control. That is legitimate complexity. It becomes avoidable delay when the requirements surface in week three instead of at scoping.
- Delivery risk kept in a separate document: Risk registers reviewed in a weekly status ceremony surface problems after the intervention window has closed. Risk that updates when the project updates gets caught while it is still cheap to fix.
Wellingtone's State of Project Management 2026 research points to the same root. Around a quarter of projects are run without a scoping document created during planning, and unstructured intake produces exactly this pattern. The answers exist somewhere, but nobody can act on them.
Any one of these produces a one-week slip that nobody escalates. Combined, they turn a 45-day target into a 90-day reality, and no single owner ever appears responsible.
By the numbers
- Inaccurate requirements management is the primary cause of projects missing their original goals 47% of the time. PMI, Pulse of the Profession research on requirements management.
- 73.8% industry on-time delivery rate for professional services projects, which means roughly one in four is delivered late. SPI Research, 2026 Professional Services Maturity Benchmark.
- 81.5% on-time delivery among high-performing service organizations. SPI Research, Professional Services Maturity Benchmark.
- 66.4% billable utilization across the industry, the lowest point in SPI's surveying history. SPI Research, 2026 Benchmark.
- Around a quarter of projects are run without a scoping document created during planning. Wellingtone, The State of Project Management 2026.
Why these causes compound instead of adding up
Scattered channels make ownership impossible to enforce. Absent ownership removes any consequence for silence. No consequence means the kickoff gets scheduled whether or not the customer has responded.
Each failure removes the control that would have caught the next one. A team firefighting all five at once is not undisciplined. It is working without the structure that would make discipline possible.
Five small slips. One 90-day implementation.
See where each one gets caught before it compounds.
How do you measure time to value, and what are most teams actually capturing?

Five time-to-value metrics matter for implementation teams. Time to first value, time to go-live, customer task completion rate at day 7 and day 14, effort hours versus planned, and milestone customer satisfaction. Most teams measure only time to go-live, which means they miss the four leading indicators that would let them improve before a project closes.
The five time-to-value metrics worth tracking
- Time to first value: When did the customer complete the first success milestone agreed before kickoff? This is the TTV metric that predicts renewal. It has to exist as a named milestone in the live project, not as a calculation you run afterward.
- Time to go-live: The baseline operational milestone. Easiest to measure and least predictive on its own. Necessary for revenue recognition, insufficient for retention.
- Customer task completion at day 7 and day 14: The strongest leading indicator available. Below 50% at day 7 means the project is already at risk while the intervention window is open. Below 50% at day 14 means delay is likely, and that window is closing.
- Effort hours versus planned: Actual versus estimated effort by task type. Large variances tell you which templates are wrong, and a wrong template propagates as a scheduling error into every future project that uses it.
- Milestone customer satisfaction: A short check at each phase milestone rather than only at project close. Post-project customer satisfaction is a postmortem. Mid-project satisfaction is something you can still act on.
None of these five survive manual collection. The moment measuring costs more than the insight returns, the measurement quietly stops. All five have to be recorded as a byproduct of normal delivery work.
What is the time to value formula, and how do you calculate it?
The time to value formula is deliberately simple. Time to value equals the date of the defined value event minus the contract signature date, expressed in calendar days. Reporting tools label the same figure time to value, TTV, and time to value TTV, but the underlying arithmetic does not change.
Two rules keep the time to value calculation honest. Always count in calendar days rather than working days, because the customer experiences elapsed time and not your capacity calendar. And always count from signature rather than from kickoff, because the weeks before kickoff are exactly where implementations lose ground.
For portfolio reporting, calculate the median instead of the mean. One 180-day enterprise rollout will drag an average that otherwise looks healthy. Report median TTV alongside the spread, and time-to-value measurement becomes something leadership can act on rather than argue with.
Used this way, the TTV metric works as a genuine time-to-value KPI. It has a formula, an owner, a target per segment, and a leading indicator attached to it. Speed to value stops being a slogan and becomes a number on a dashboard.
How do you define the value event before kickoff?
A defined value event is the specific, measurable moment that signals the customer has received what they paid for. Four steps make it usable.
- Confirm the outcome the customer described during the sales process. Not the feature they liked, the business result they expected.
- Identify the earliest measurable signal that they are on the path to it. This becomes the TTFV milestone.
- Agree the definition in writing before the kickoff call, not during it. A value moment negotiated live becomes a value moment nobody owns.
- Enter it in the project as a named milestone with a target date, sitting alongside go-live rather than replacing it.
The test is simple. "The customer is using the platform" cannot be measured. "First monthly utilization report generated and reviewed by the VP of Professional Services" can be. Vague value events are why so many teams cannot measure time to value at all.
Write the definition down as shared success metrics owned by both sides. Prescriptive onboarding works because the customer knows which outcome the plan drives toward. Nobody has to guess what meaningful value looks like when the first report runs.
What delivery leaders said on the Propel stage
Rocketlane's Propel conferences bring professional services and implementation leaders together every year, and the value moment kept coming up.
- Set the goal before the handoff. At Propel26, Kristen Hayer of The Success League explained how to set customer goals during onboarding, and why waiting until the customer success handoff hurts retention.
- Go-live is the wrong finish line. Chris Pinaire of Global Shop Solutions made the case for measuring what happens after go-live, not at it.
- Design for an early win. At Propel22, Irit Eizips presented a first value delivery framework built around early, visible outcomes.
- Measure outcomes, not activity. PropelX 2026 in London ran on one question: AI is here, but where are the outcomes? The PropelX 2026 recap covers how services teams are answering it.
From a blank template to a measured time to value
See it on one of your own implementations.
How to track TTV trends across segments and cohorts
A single average hides everything useful. Segment the number before you act on it.
Track TTV trends by customer size, by product edition, by integration count, and by implementation manager. Ask how many users each customer activated in the first 30 days, and how quickly users reached their first value event. Compare user segments that self-serve against those needing guided configuration.
Patterns appear fast. One segment may run 20 days longer because it always needs complex integrations. Another may drift because a single template underestimates the training process. Tracking TTV at that resolution turns a lagging report into a planning input.
Median time to value by segment. No spreadsheet
Track planned against actual first value on every live project.
Did you know?
What does good time to value look like for B2B SaaS companies in 2026?

Good looks like consistent on-time delivery above 80% across the portfolio, with a defined value event tracked separately from go-live. SPI Research puts the industry on-time rate at 73.8% and high-performing organizations at 81.5%. Roughly one in four projects is delivered late, so the benchmark to beat is lower than most teams assume.
Benchmark box
These figures frame what good looks like and how far the industry average sits from it.
The utilization line is the one worth pausing on. Billable utilization at 66.4% is the lowest figure SPI has recorded. The average team is absorbing more non-billable work than at any point in the study's history. Reducing customer onboarding time is one of the few levers that moves both numbers at once.
How time to value varies by product complexity and user segments
There is no single correct TTV target. Your product's complexity sets the floor, and your user segments set the spread. Published time to value SaaS benchmarks are unreliable for exactly this reason.
A self-serve SaaS product where new users reach the core benefit in the first session should measure immediate time to value in minutes. A platform requiring complex integrations, data migration, and a formal training process will measure basic value in weeks. Comparing the two tells you nothing about how quickly users experience value in either one.
What travels across both is the shape of the improvement. Faster users reach value when setup work is removed, when the first meaningful outcome is defined in advance, and when nobody has to guess what happens next. Real-world examples from enterprise implementations and self-serve onboarding flows converge on that same conclusion.
Set targets per segment and per edition. Then hold each segment against its own history rather than against an industry average built from a different product shape.
73.8% on time is the average. Where does yours sit?
Bring your last ten go-live dates. We will map them against first value.
Why does customer task completion determine time to value more than team speed?

In most implementations, the binding constraint on time to value is customer task completion, not internal throughput. Customer data migration, access provisioning, sign-offs, and configuration decisions sit on the critical path. Those tasks often live in email, with no dependency chain and no automated reminders. The implementation then waits on the customer while the project manager waits on an answer.
Why email-based follow-up fails
A task communicated by email has no shared record. There is no due date the customer agreed to, no visibility into what breaks if it is late, and no consequence connected to the go-live milestone.
So the project manager becomes the accountability mechanism. They compose the same follow-up every week, each one a slightly more apologetic version of the last. The customer reads it as a nudge rather than a dependency.
Teams diagnose this as customer readiness, as though it were a fixed property of the account. It is a design problem, and design problems have fixes.
What visible accountability looks like
Three things have to be true at the same time. Any one missing and the other two stop working.
- Customer tasks assigned explicitly in a shared portal, with a named owner, a due date, and one line explaining what the task unlocks. Not an email attachment, and not a separate spreadsheet.
- The dependency chain visible to the customer. Their pending data migration blocks the integration phase, which blocks user acceptance testing, which blocks go-live. That is information, not pressure, and customers who can see it behave differently.
- Automated reminders are sent by the system at three days before due and again at overdue. The project manager is copied. The project manager is not the sender.
When the system sends the reminder, the follow-up becomes informational. The discomfort a project manager feels writing a chase email disappears the moment they stop being the one writing it.
Why the portfolio view is the missing piece
A project manager running 25 concurrent implementations cannot open each project to find which customer tasks are overdue. The signal has to come to them.
The useful format is a portfolio alert. Six implementations have customer tasks overdue at day 7. Three sit below 50% completion. Without that view, delay gets discovered one project at a time, usually after it has already compounded into a moved date.
Cost of inaction
Without a structured accountability mechanism, implementation managers spend hours every week composing manual follow-ups across every active project. That overhead displaces billable delivery work, and it spends your customers' time as well as your own.
The go-live date moves by the same number of days the task sat unanswered. The project manager sends an apology. The customer begins to form an opinion about how the relationship works.
The go-live date moves by every day a task waits
Let the system send the reminder, so you never write the chase email
How do you shorten time to value inside the onboarding flow itself?
Shorten TTV inside the onboarding flow by removing setup work rather than explaining it. Use smart defaults so the product arrives configured. Guide users toward one specific task that delivers the core benefit. Instrument the flow so you can spot friction points where new users drop. The goal is a shorter path to the first value event, not a more thorough tour.
Guiding users to the aha moment faster
Every product has an aha moment. It is the point where the value proposition stops being a claim and becomes something the user has experienced.
Find it by looking at retained customers rather than at your feature list. Identify the key events that separate accounts still active at 90 days from those that churned. Those value events are what user onboarding should drive toward, and they usually mark the point where a trial becomes a paying customer.
Then remove everything between sign up and that moment. Guiding users through nine configuration screens before the first meaningful outcome is how a strong product produces a weak onboarding experience. Advanced features can wait until the core benefit has landed.
This is where customer experience and commercial outcome meet. Users who experience meaningful value in the first session convert to paid plans at higher rates. They also need less of your customer success team's time later.
Smart defaults and default settings that remove setup work
Every setting you ask a new customer to choose is a decision they are not qualified to make yet. They have not used the product, so they are guessing.
Smart defaults invert that. Ship sensible default settings based on what worked for similar customers, then let users change them once they understand the trade-off. A customer starts inside a working configuration rather than an empty one, which is the cheapest way to deliver a shorter TTV.
The same logic applies to enterprise implementations. Conditional templates that pre-select phases based on edition, integration count, and user segment do for a project plan what smart defaults do for a product. Both replace a blank page with a defensible starting point.
Sequence the rollout too. Ship basic services first, confirm the core benefit has landed, then introduce advanced features and new features once the habit exists. Trying to shorten TTV and demonstrate depth in the same week usually achieves neither.
How to spot friction points where new users drop
Instrument the onboarding flow at the level of user actions, not page views. Track account creation, first session activity, first configuration saved, and the first value event.
Then look for the step where completion falls off a cliff. That is the friction point. Usually it is a moment where users expect one thing, and the product asks for another. Sometimes a required input lives in a system the user cannot access.
Resist the instinct to blame length. Form analytics firm Zuko found that form length alone is not a reliable predictor of completion rate. What matters is whether the person can answer accurately right now, without chasing a colleague, so the useful question is about difficulty rather than field count.
Fix the drop-off before adding new features. A new feature reaches only the users who survived the flow. Improving the flow reaches everyone, and it lifts user engagement across every segment at once.
Common approach vs right approach
What should you look for in a platform built to reduce time to value?

A platform built for TTV reduction does five things a general project management tool cannot do natively. It creates projects automatically from CRM data with the right template applied. It assigns tasks to customers without login friction. It tracks time to first value as a measured milestone. It surfaces customer task completion risk at portfolio level. And it maintains one plan rather than parallel internal and client-facing documents.
The five capabilities that separate a PSA from a project management tool
- CRM-triggered project creation: The plan should exist before the kickoff call, not three days after the deal closes. Native Salesforce and HubSpot integration should create the project, apply a conditional template based on deal attributes, populate deal context, and invite the customer automatically.
- A client portal without login friction: Customers will not maintain a credential for a system they open once a month. Magic-link access, white-labeled and mobile-responsive, means they see tasks and milestones without account creation. If the portal needs a password reset, adoption drops, and everyone reverts to email.
- Time to first value as a tracked milestone: The value event has to live in the project as a named milestone alongside go-live. Teams that track it in the system improve faster than teams calculating it from closed projects. They can see drift while the window is still open.
- Customer task completion as a portfolio signal: Not a number buried inside individual projects. A cross-project view showing which implementations sit below 50% completion at day 7 and day 14, surfaced proactively rather than after the delay.
- One plan, not two documents: An internal plan plus a separate client-facing status deck is where synchronization breaks. One plan with visibility controls decides what the customer sees and what stays internal. Two artifacts is how "updated" and "accurate" become different words.
Together these five turn intake and delivery into one system. Miss any of them, and the project manager quietly becomes the integration layer between the other four.
It is worth being honest about the alternatives. A general project management tool handles task tracking well and financial visibility poorly. Other solutions cover onboarding only and stop at go-live. Time to value reduction needs both halves, which is why the evaluation usually lands on professional services automation rather than a point tool.
Decision routing table
Where you start depends on portfolio size and where your process breaks first.
The pattern across every row is the same. Fix the constraint that is binding before buying capability you will not use yet.
Found your row? Start with the constraint that binds
Bring your portfolio size and your biggest delay. We will map the first fix
What should you know before overhauling your onboarding process?
Four things decide whether the overhaul works. Fix the process before choosing a tool. Plan for internal resistance. Start with visibility rather than automation. And weigh what the platform costs to run against the hours it returns.
- On common mistakes: Most teams buy software before deciding who owns customer intake. A slow onboarding process inside a new platform is still a slow onboarding process. Define ownership, triggers, and deadlines first.
- On cost: Modern PSA platforms sit in the mid-to-upper range for delivery software. Measure against SPI Research's 75% billable utilization benchmark, and model the payback from the non-billable hours your own team recovers.
- On reporting: Older platforms made custom reporting painful enough that teams stopped asking questions. Natural language analytics now answer portfolio questions directly, so you no longer need an operations analyst to find out which implementations are drifting.
- On scope: Some tools handle onboarding only. If you also run ongoing services, migrations, or technical account management, evaluate full professional services automation rather than a point solution that stops at go-live.
Get these four right, and the overhaul stops being a tooling bet. It becomes an operational change with a payback period you can defend in a budget conversation.
How Rocketlane reduces time to value in customer onboarding

Rocketlane is an agentic AI-powered PSA platform built for customer-facing professional services teams. It combines CRM-triggered project creation, a white-labeled client portal, time-to-first-value milestone tracking, and portfolio-level risk intelligence in one connected system.
Teams choose Rocketlane to reduce time to value because it operates as a connected system rather than three tools held together by weekly reporting. The CRM integration creates the project before the kickoff call.
The client portal makes accountability automatic, with customer tasks assigned, dependencies visible, and reminders sent by the system instead of the project manager. Portfolio intelligence surfaces which implementations are at risk at day 7, before the delay has time to compound.
CRM-triggered project creation that starts delivery informed
A Salesforce or HubSpot deal closes. The project is created automatically, and a conditional template is applied based on deal attributes. Deal context populates the project. The customer is invited to the portal before the kickoff email goes out.
The implementation starts informed rather than blank. Requirements the sales team captured during the sales process feed straight into delivery, so nobody asks the customer for information they already provided. Being asked twice in week one damages the onboarding experience faster than almost anything else.
A client portal that replaces the status email thread
Customers see every outstanding request organized by phase, with progress visible and the dependency chain shown. Access is by magic link, white-labeled and mobile-responsive, so there is no account creation and no password to recover.
Automated reminders escalate on a defined schedule without a project manager writing anything. Rocketlane gives clients real-time visibility into what is needed and what is done. That cuts the volume of "where are we?" emails and keeps both sides on the same plan.
Time to first value tracked as a live milestone
Define the value event at kickoff and enter it as a named milestone alongside go-live. Rocketlane then tracks planned against actual TTFV across the portfolio.
That single change converts time to value from a retrospective calculation into a managed metric. You can see which implementations are drifting from target while there is still time to act, and compare performance across user segments, editions, and implementation managers.
Your next project starts the day the deal closes
Not the day someone finds an hour to build the plan.

How Rocketlane Nitro applies agentic AI to time to value
Nitro is Rocketlane's agentic AI layer. It sits on top of the PSA system and runs across delivery operations, and its agents do delivery work rather than describe it. Nitro works across three levels: operations, delivery, and work execution.
Level 1, Operations
Nitro Analyst (generally available) answers portfolio questions in plain English. A delivery lead can ask which implementations are most likely to miss their TTFV target this month, and the answer arrives in seconds without building a report.
Level 2, Delivery
Project Governance (early access) turns delivery SOPs into automatic guardrails, catching issues before go-live rather than after.
Nitro Signals (beta) continuously scans customer conversations and surfaces early indicators of risk or opportunity, with every finding traced back to the conversation it came from. Nitro Meetings records and transcribes project meetings so discovery context stops living in scattered notes, and AI Fills generates summaries and action items automatically.
Level 3, Work execution
The Workforce Agent (early access) converts a signed statement of work into a structured project plan with tasks, phases, dependencies, and resource types. Delivery starts on day one instead of day five. Rocketlane's planning model for a 25-person delivery team projects 90% of manual project setup and 95% of manual configuration work automated.
Rocketlane Migration Agent takes over data preparation, transformation, and validation, catching data issues before they reach production so the go-live date does not move.
The same planning model projects a 12% reduction in time-to-go-live from that agent alone.
The Documentation Agent (early access) pulls context from calls, emails, and project activity. It generates structured documents against your own templates, then keeps them current as the project evolves. The planning model projects a 35% reduction in onboarding and handoff time, which is time taken directly out of the TTV clock. These are planning-model figures, not measured customer outcomes.
This is the shift from merely tracking work to actively executing it. The gap it targets is real. SPI Research puts industry on-time delivery at 73.8%, while high-performing organizations reach 81.5%. Much of that distance is non-billable administrative work that agents can now absorb.
With vs. without Rocketlane
The contrast below is what changes operationally when onboarding intake, customer accountability, and delivery execution share one system.
The proof points are public. Rocketlane raised a $60 million Series C led by Insight Partners in March 2026. It serves 750+ customers, holds 4.7 out of 5 from 758 G2 reviews, and 94% of verified G2 Enterprise reviewers recommend it.
See how Rocketlane tracks and reduces time to value across your implementation portfolio. Book a 20-minute demo.
Conclusion
The contract was signed. The clock started. Most teams did not begin measuring until the project closed.
Time to value is not a number you calculate at the end of an implementation. It is a design choice you make at the beginning. The value event is agreed before kickoff. The customer tasks visible in the shared plan with the dependency chain attached. The leading indicators tracked from day one, so a project at risk on day 7 is not a surprise on day 45.
The teams compressing TTV are not working harder. They run implementations that hold customers accountable through the plan rather than through follow-up emails. They surface risk before it compounds. They measure first value as a milestone rather than a postmortem.
There is a second effect that rarely makes it into a business case. A customer who knows exactly what the process expects of them moves faster without being asked. Name what each customer expects to receive and what you expect in return, and the relationship changes shape.
Billable utilization sits at 66.4%, the lowest point in SPI Research history, while high performers hold a meaningful lead. Much of that gap is non-billable administrative work that agentic AI can now absorb. Teams that accelerate time to value are usually the ones that stopped doing that work by hand.
One habit compounds the gains. After each go-live, ask a short set of questions about which requests felt unclear and where customers reach for help. That feedback shows exactly where customer expectations and your onboarding process diverged, and it makes faster time to value repeatable rather than accidental.
Ready to stop calculating time to value after the fact? Book a 20-minute Rocketlane walkthrough.
The contract is signed. Your plan is still blank
See the project, the portal and the value milestone ready before kickoff.

Authored by

Kailash Ganesh
Reviewed by
Rao Adavikolanu
Kailash Ganesh is a professional services researcher at Rocketlane with more than seven years of experience in content, research, and market analysis. He studies how enterprise PS teams are adopting agentic AI to transform delivery operations, has evaluated every major PSA platform in the category, and writes from the perspective of a practitioner who watches enterprise PS teams make these exact decisions daily.
Table of Contents

Regsiter for the live webinar


Great consultants didn't join your team to spend Fridays writing documentation.
Table of contents
18 of Forbes Cloud 100 chose Rocketlane. The best PS teams aren't waiting around.
FAQs
What is time to value in customer onboarding?
Time to value in customer onboarding is the duration from contract signing to the moment a customer achieves their first measurable business outcome from the product. For professional services and customer success teams, it predicts renewal and expansion more directly than any other delivery metric. It is distinct from go-live because a customer can be technically live and still weeks away from the outcome they purchased.
What is the difference between time to value and time to go-live?
Time to go-live is an operational milestone marking the date the implementation technically completes. Time to value is an outcome milestone marking the date the customer achieves the business result they bought. These dates are often different. Time to value requires defining that outcome before kickoff, while go-live only requires finishing the work.
What is time to first value, and how do you measure it?
Time to first value is the duration from contract signing to the customer's first success milestone. That milestone is the earliest measurable signal that they are on the path to their outcome. Agree the value event before the kickoff call. Enter it as a named milestone in the live project, then compare planned against actual at close. Teams that track TTFV in the system improve faster than teams calculating it retrospectively.
What causes slow time to value in professional services implementations?
Five causes recur. Customer deliverables tracked in email with no accountability mechanism. A sales-to-delivery handoff that loses context. Manual project creation overhead at deal close. Complex integrations discovered mid-project. And delivery risk kept in a document reviewed once a week. The first is the most common and the most consistently misdiagnosed. Teams treat customer task completion as a fixed property of the account. It is a design problem.
What are realistic time-to-value benchmarks for B2B SaaS companies?
SPI Research's 2026 Professional Services Maturity Benchmark puts industry on-time delivery at 73.8%. High-performing organizations reach 81.5%. Roughly one in four projects is delivered late. Average project overrun sits at 10.7%. Timeline benchmarks vary widely by product complexity, so set targets per user segment and product edition rather than against a single industry average.
How do you get customers to complete onboarding tasks faster?
Three things have to work together. Assign tasks explicitly in a shared portal, with a named owner and a due date. Show the customer how their pending tasks connect to the go-live date. Automate the reminders so the system sends them, not the project manager. When any one is missing, the project manager fills the gap with a weekly follow-up email that nobody enjoys, and few customers prioritize.
What time-to-value metrics should implementation teams report to leadership?
Report five. Time to first value, planned versus actual. Time to go-live. Customer task completion rate at day 7 and day 14. Effort hours versus planned by task type. And milestone customer satisfaction. All five require a platform where the data is captured as a byproduct of delivery work, because manual collection costs more than the insight returns.
How does agentic AI reduce time to value for onboarding teams?
Agentic AI removes work rather than reporting on it. Rocketlane's Workforce Agent converts a statement of work into a structured project plan so delivery starts on day one instead of day five. The Documentation Agent generates handoff and solution documents from calls and project activity, and Rocketlane's planning model for a 25-person delivery team projects a 35% reduction in onboarding and handoff time. Nitro Signals detects risk in customer conversations before it appears in a status call.
How do you shorten time to value for self-serve SaaS users?
Identify the aha moment by studying which key events separate retained customers from churned ones, then remove every step between sign up and that moment. Use smart defaults so new users start inside a working configuration instead of an empty one. Instrument the onboarding flow at the level of user actions to spot friction points where users drop, and fix those before shipping new features.
How do you define the value moment for a professional services engagement?
The value moment is the specific, measurable event signaling the customer has received the business outcome they purchased. Define it in four steps. Identify the outcome stated during the sales process. Find the earliest measurable signal on the path to it. Confirm the definition in writing before kickoff, then enter it as a milestone in the project. "The customer is using the platform" cannot be measured. "First monthly utilization report generated and reviewed by the VP of Professional Services" can. Still mapping the path from a blank project template to a measured time to value? Book a 20-minute Rocketlane walkthrough.













Copyright © 2026 Rocketlane Corp. All rights reserved.